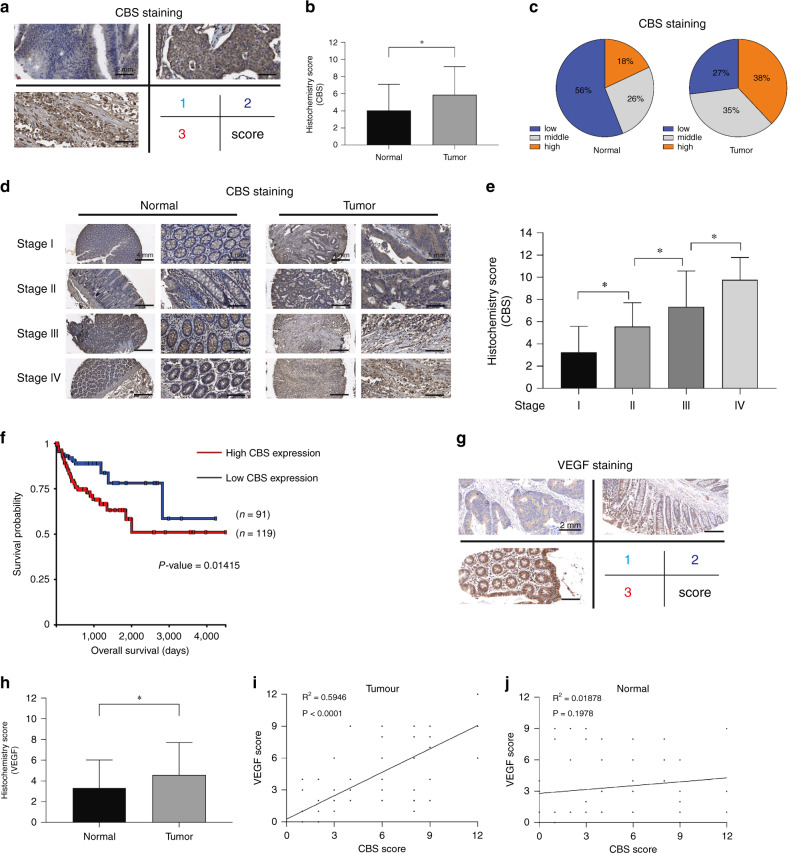
Fig. 3. The correlation between CBS and VEGF expression in colon cancer tissues.
a Representative images of different levels of CBS immunohistochemical staining in the tissue microarray. b CBS histochemical score in the tumour tissues (n = 90) and adjacent normal tissues (n = 90) in the microarray. c The ratios of high, moderate and low expression regions in the tumour tissues and adjacent normal tissues in the microarray. d Representative images of CBS immunohistochemical staining in different-stage tumour tissues (n = 90) and adjacent normal tissues (n = 90) in the microarray. e Immunohistochemical score for CBS in different-stage colon tumour tissues in the microarray. (stage 1 = 28 cases; stage 2 = 28 cases; stage 3 = 21 cases; stage 4 = 13 cases). f Survival curve showing the impact of CBS expression on overall survival in the TCGA-OV dataset. (The figure was generated with UCSC Xena, https://xena.ucsc.edu/). g Representative images of different levels of VEGF immunohistochemical staining in the tissue microarray. h VEGF histochemical score in tumour tissues (n = 90) and adjacent normal tissues (n = 90) in the microarray. i Correlation analysis of the histochemical scores of CBS and VEGF in tumour tissues. j Correlation analysis of the histochemical scores of CBS and VEGF in adjacent normal tissues. *P < 0.05.

