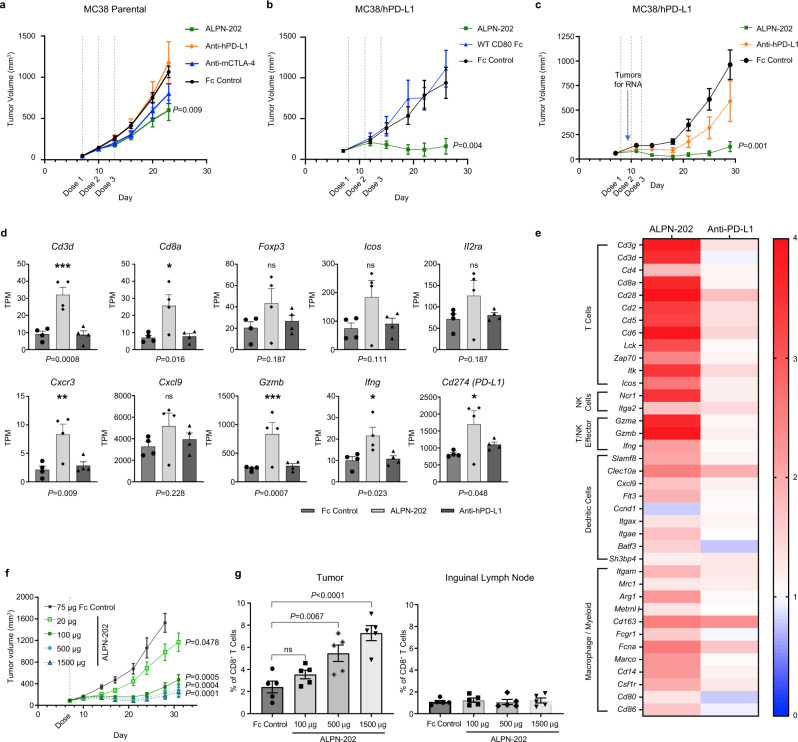
Fig. 5. ALPN-202 demonstrates potent and dose-dependent anti-tumor activity in vivo in a MC38/human PD-L1 tumor model.
a ALPN-202 induced a small but significant decrease in tumor growth relative to Fc control in a parental MC38 tumor model. (n = 10 mice/group). b, c In MC38/hPD-L1 tumor studies, ALPN-202-mediated anti-tumor activity (green) was superior to wild type WT CD80 ECD-Fc (blue), anti-PD-L1 (durvalumab, orange), or isotype control (black) (n = 10 mice/group). WT wild type; ECD extracellular domain. d A subset of tumors from study shown in (c) were harvested 72 h after the first dose and RNAseq performed. Transcripts per kilobase million reads (TPM) of select genes for individual tumors are shown. Individual points represent TPM for individual tumor samples and bars indicate mean values ± SEM. e Signature transcripts from the indicated immune cell populations were identified using the ImmGen Population Comparison application [https://www.immgen.org/ImmGenpubs.html]. The heatmap compares the fold increase (red) or decrease (blue) in mean transcript levels of either ALPN-202-treated or anti-PD-L1 treated tumors relative to Fc-control-treated tumors (n = 4 tumor samples per group). f ALPN-202-treated MC38/hPD-L1 tumors (n = 12 mice/group) showed a dose-dependent increase in anti-tumor activity. g 72 h after treatment there was a dose-dependent increase in intratumoral p15E+ tumor antigen-specific CD8+ T cells. No change was observed in inguinal lymph nodes. N = 5 samples from each group (individual symbols) and bar height indicates mean percentage of p15E+ CD8+ T cells. Error bars are SEM. Gating strategy is summarized in Supplementary Fig. 7. Statistical significance was determined by one-way ANOVA with Dunnett’s multiple comparisons test (d, g) or by repeated-measures two-way ANOVA for treatment effects (a, b, c, f). P values shown are ALPN-202 vs Fc control. For all studies except (f, g), antibodies and ALPN-202 were treated at 100 µg/dose while Fc control was 75 µg/dose. For all graphs, the means ± SEM are shown. Source data are provided as a Source Data file.

