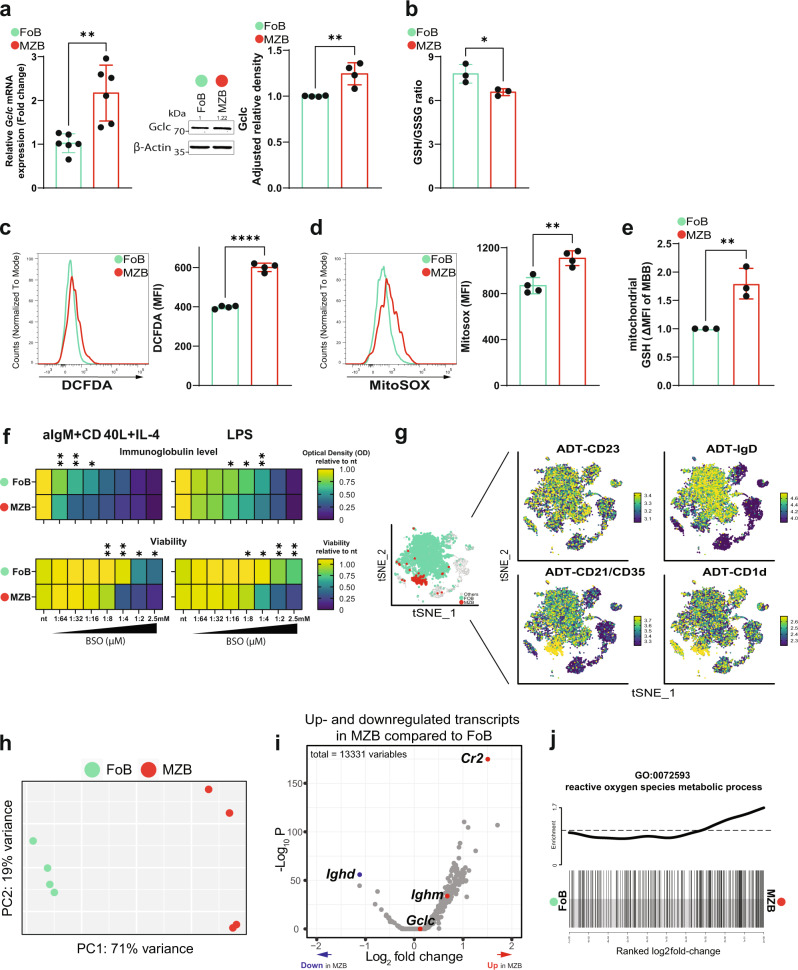
Fig. 1. GSH-dependent redox activity differs between FoB and MZB.
a Left: RT-qPCR of Gclc mRNA expression in resting Gclc-sufficient FoB (green) and MZB (red) isolated from spleen of B6 mice (n = 5 animals examined over three independent experiments). Middle: representative blot of Gclc protein from total cell lysis of resting B6 FoB and MZB (n = 3 animals examined over three independent experiments). Right: relative density of Gclc protein expression in resting B6 FoB and MZB (n = 3 animals examined over three independent experiments). b Luminescence-based quantitation of intracellular GSH/GSSG ratio in resting FoB and MZB isolated from B6 mice (n = 3 animals examined over three independent experiments). (c–d) Representative histogram and quantitation of DCFDA (c) and MitoSOX (d) staining for intracellular ROS and mitochondrial (mt) ROS detection in splenic B6 FoB and MZB (gated as in Supplementary Fig. 1a). e Flow-cytometry-based quantitation of monobromobimane (MBB) for the detection of GSH in purified Tom20+ mitochondria from B6 FoB and MZB (gated as in Supplementary Fig. 1a) (n = 3–4 animals examined over two independent experiments). f Heatmap showing relative expression of immunoglobulin level (top) and viability (bottom) of 4d activated B6 FoB and MZB with increasing concentration of BSO. g tSNE plot showing SCINA assignments of Gclc-sufficient FoB and MZB (left) isolated from spleen of Gclcfl/fl mice (gated as in Supplementary Fig. 1b) and based on the ADT signals of CD23, IgD, CD21/35, and CD1d markers (right). Green: FoB; Red: MZB; Grey: unassigned B cells. Data are pooled from 4 Gclcfl/fl mice. Sidebars represent the ADT expression scale. h PCA plot showing distinct transcriptome patterns of Gclc-sufficient FoB and MZB transcriptomes from 4 Gclcfl/fl mice. i Volcano plot of differentially expressed genes in resting Gclc-sufficient FoB vs. MZB. Data represent up- and downregulated transcripts in Gclc-sufficient MZB compared to Gclc-sufficient FoB. Red/blue dots indicate upregulated/downregulated signature genes in resting Gclc-sufficient MZB compared to FoB. j Barcode plot showing enrichment of GO:0072593 gene list (reactive oxygen species metabolic processes) in resting Gclc-sufficient MZB compared to FoB. For all applicable figure panels, data are mean ± SD and each dot represents one single mouse. Significance (P) was calculated with unpaired t-test, except for (f) (2 way ANOVA). *P ≤ 0.05; **P ≤ 0.01; ****P ≤ 0.0001.

