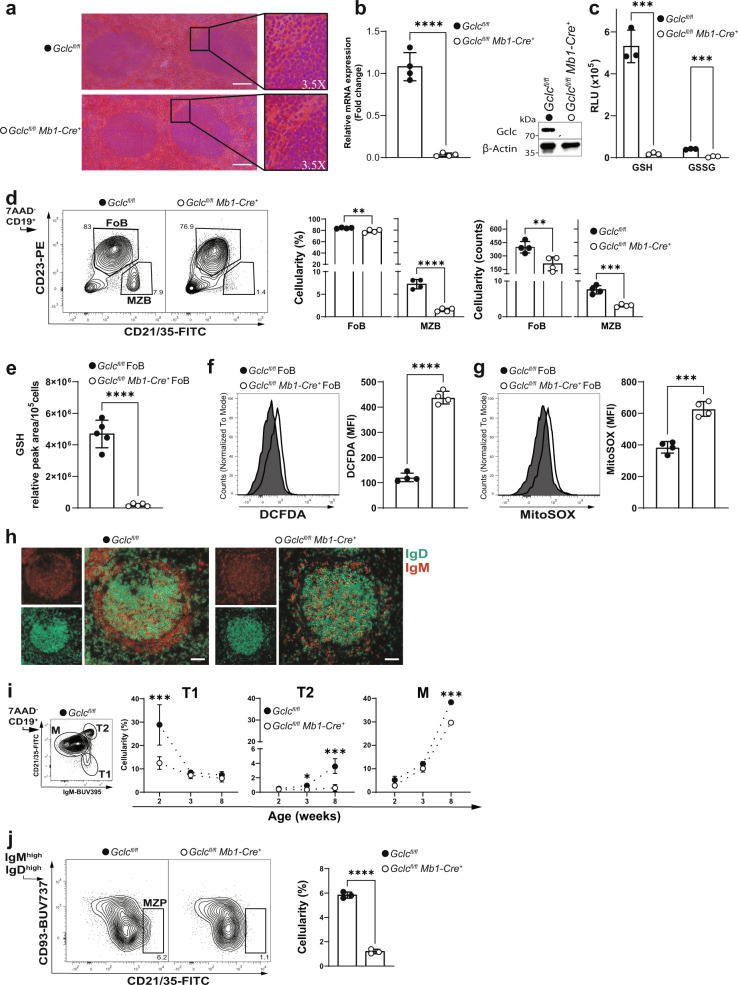
Fig. 2. Gclc depletion induces a stark reduction in MZB.
a Histology of spleen follicles resected from one Gclcfl/fl and one Gclcfl/fl Mb1-Cre+ mouse and stained with haematoxylin and eosin. Scale bars, 50 µm. Insert digital magnification, 3.5×. b Left: RT-qPCR of Gclc mRNA of total splenic B cells isolated from Gclcfl/fl and Gclcfl/fl Mb1-Cre+ mice (n = 4 animals examined over four independent experiments). Right: Representative immunoblot of Gclc protein in total splenic B cells isolated from spleen of Gclcfl/fl and Gclcfl/fl Mb1-Cre+ mice (n = 4 animals examined over three independent experiments). c Luminescence-based quantitation of intracellular GSH and GSSG in total splenic B cells isolated from Gclcfl/fl and Gclcfl/fl Mb1-Cre+ mice (n = 3 animals examined over three independent experiments). d Representative contour plot (left), percentages (middle) and numbers (right) statistic of splenic FoB and MZB from Gclcfl/fl and Gclcfl/fl Mb1-Cre+ mice (gated as in Supplementary Fig. 1a) (n = 4 animals examined over five independent experiments). e Relative quantitation via LC-MS of GSH from resting FoB of Gclcfl/fl and Gclcfl/fl Mb1-Cre+ mice (n = 5 animals examined over two independent experiments). Representative histogram and quantitation of DCFDA (f) and MitoSOX (g) staining for intracellular ROS and mitochondrial (mt) ROS detection in splenic FoB from Gclcfl/fl and Gclcfl/fl Mb1-Cre+ mice (gated as in Supplementary Fig. 1a) (n = 4 animals examined over three independent experiments). h Representative immunofluorescence staining to detect IgD (green) and IgM (red) in a single spleen follicle resected from one Gclcfl/fl and one Gclcfl/fl Mb1-Cre+ mouse. Scale bars: 50 µm. i Representative contour plot of splenic Gclcfl/fl M, T1, and T2 B cells used to determine the percentages over time (weeks) of the gated population from spleens of Gclcfl/fl and Gclcfl/fl Mb1-Cre+ mice (n = 2–3 animals examined over three independent experiments). j Representative contour plot (left) and percentages statistic (right) of splenic MZP from Gclcfl/fl and Gclcfl/fl Mb1-Cre+ mice (gated as in Supplementary Fig. 1a) (n = 3 animals examined over three independent experiments). For all applicable figure panels, data are mean ± SD and each dot represents one single mouse, except for (f) where each panel represents the mean of 2–3 mice. In contour plots, numbers represent percentages of the cells gated. Significance (P) was calculated with unpaired t-test, except for (c) (2way ANOVA). *P ≤ 0.05; **P ≤ 0.01; ***P ≤ 0.001; ****P ≤ 0.0001.

