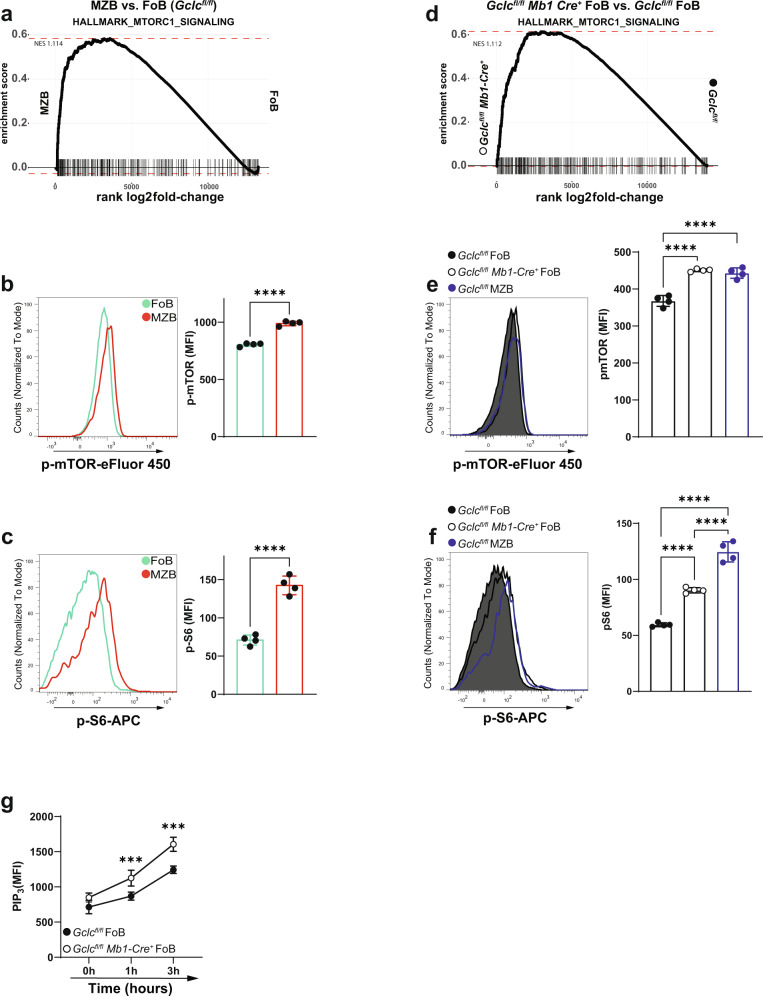
Fig. 3. mTORC1 is comparably elevated in Gclc-sufficient MZB and Gclc-deficient FoB.
a GSEA plot comparing expression of mTORC1 signaling hallmark gene sets between Gclcfl/fl FoB and Gclcfl/fl MZB. Representative histogram (left) and quantitation (right) of immunostaining to detect p-mTOR (b) and p-S6 (c) in B6 FoB and MZB (gated as in Supplementary Fig. 1a) (n = 4 animals examined over three independent experiments). d GSEA plot comparing the expression of mTORC1 signaling hallmark gene sets between Gclcfl/fl and Gclcfl/fl Mb1-Cre+ FoB. Representative histogram (left) and quantitation (right) of immunostaining to detect p-mTOR (e) and p-S6 (f) in Gclcfl/fl and Gclcfl/fl Mb1-Cre+ FoB, including Gclcfl/fl MZB as control (gated as in Supplementary Fig. 1a) (n = 4 animals examined over four independent experiments). g Flow-cytometry measurements kinetic of PIP3 in sorted FoB from spleens of Gclcfl/fl and Gclcfl/fl Mb1-Cre+ at the indicated time points after stimulation with anti-IgM (n = 3 animals examined over two independent experiments). Data are mean ± SD. Significance (P) was calculated with unpaired t-test, except for e, f (one-way ANOVA), and g (2 way ANOVA). ***P ≤ 0.001; ****P ≤ 0.0001.

