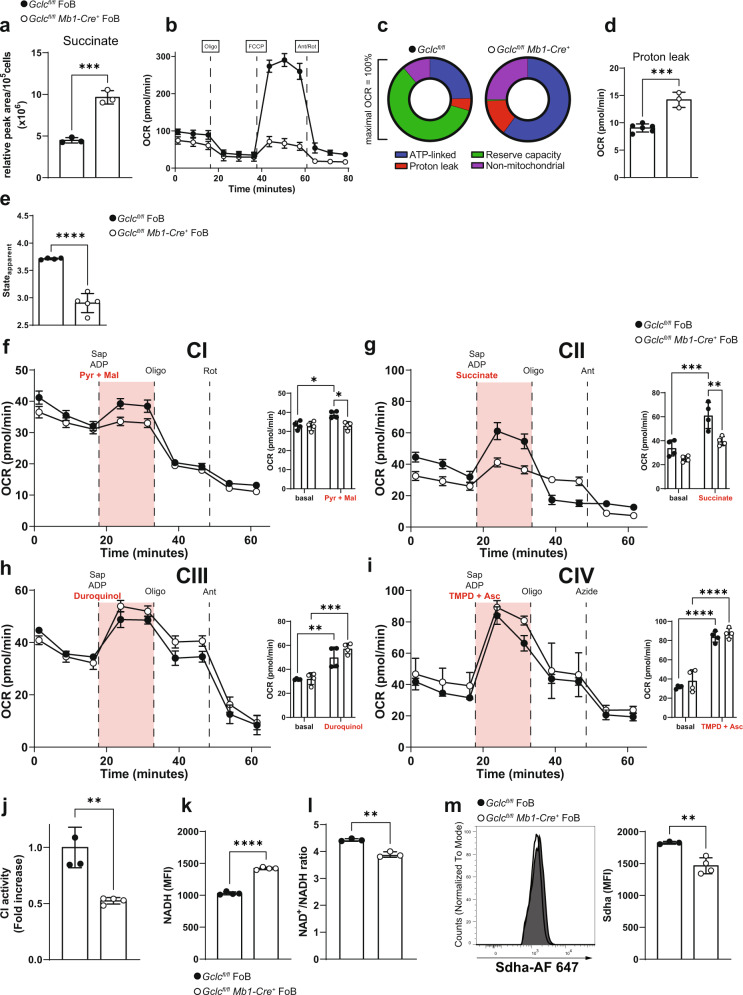
Fig. 6. Mitochondrial respiratory complex I and II are dysfunctional in Gclc-deficient FoB.
a Quantitation of intracellular succinate level measured by LC-MS in resting Gclcfl/fl and Gclcfl/fl Mb1-Cre+ FoB (n = 3 animals examined over two independent experiments). b Seahorse quantitation of OCR of resting Gclcfl/fl and Gclcfl/fl Mb1-Cre+ FoB at the indicated time points (n = 3–4 animals examined over 5 independent experiments). c OCR components from (b) plotted as proportions of maximal OCR (after FCCP treatment) (n = 3–4 animals examined over five independent experiments). d Quantitation of the contribution of proton leakage from (b) as determined by Ant/Rot treatment (n = 3–4 animals examined over five independent experiments). e Respiratory status of Gclcfl/fl and Gclcfl/fl Mb1-Cre+ FoB in (b) displayed as stateapparent (n = 3–4 animals examined over five independent experiments). f–i OCR of Gclcfl/fl and Gclcfl/fl Mb1-Cre+ FoB sequentially treated with saponin (Sap), adenosine diphosphate (ADP), and the indicated substrates (red) for ETC complexes CI (f), CII (g), CIII (h) and CIV (i), as indicated. Side bar graphs show basal and substrate-induced (red) OCR. Oligo: oligomycin A; Rot: rotenone; Ant: antimycin A; TMPD: N,N,N′,N′-Tetramethyl-p-phenylenediamine; Asc: ascorbate; Pyr: pyruvate; Mal: malate (n = 4 animals examined over two independent experiments). j Quantitation of relative activity of CI in Gclcfl/fl and Gclcfl/fl Mb1-Cre+ FoB as measured by colorimetric assay (n = 3–4 animals examined over two independent experiments). k Quantitation of NADH autofluorescence in Gclcfl/fl and Gclcfl/fl Mb1-Cre+ FoB (gated as in Supplementary Fig. 1a) as measured by FACS (n = 4 animals examined over three independent experiments). l CI activity in Gclcfl/fl and Gclcfl/fl Mb1-Cre+ FoB expressed as the ratio of NAD+ (CI substrate) to NADH (CI product), as measured by colorimetric assay (n = 3–4 animals examined over two independent experiments). m Representative histogram (left) and quantitation (right) of immunostaining to detect the expression of succinate dehydrogenase a (Sdha, the major subunit of CII) in Gclcfl/fl and Gclcfl/fl Mb1-Cre+ FoB (gated as in Supplementary Fig. 1a) (n = 3 animals examined over three independent experiments). For all applicable figure panels, data are mean ± SD and each dot represents one single mouse, except for (b) and (f)–(i) where each dot represents the mean of 3–5 mice. Significance (P) was calculated with unpaired t-test, except for f–i (2 way ANOVA). **P ≤ 0.01; ***P ≤ 0.001; ****P ≤ 0.0001.

