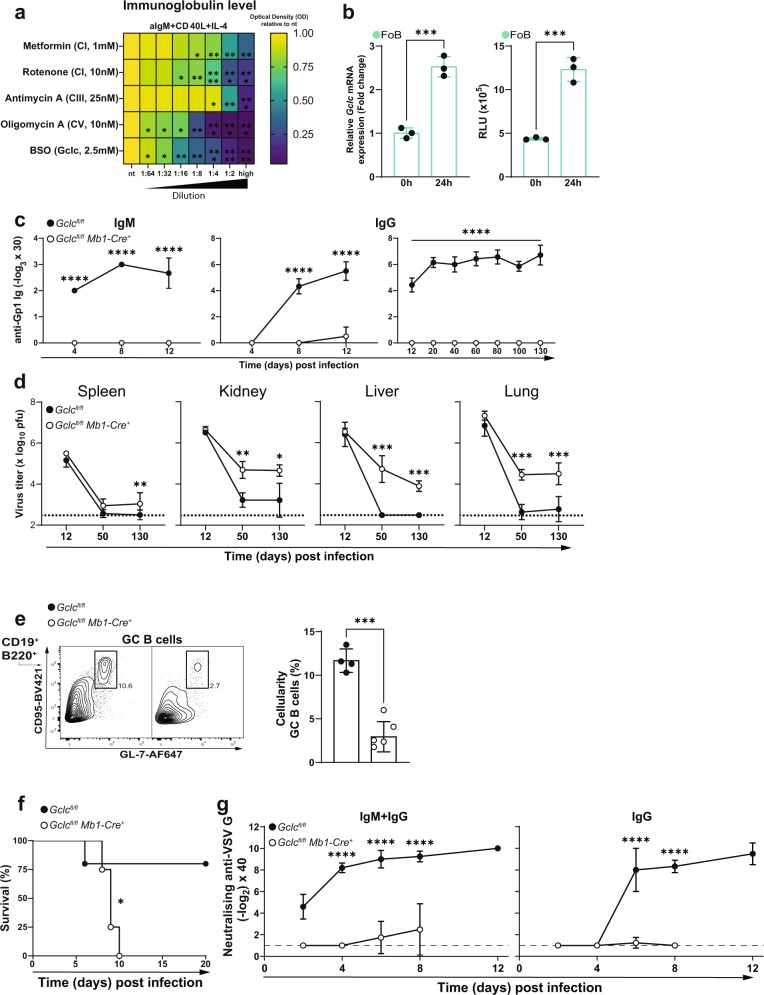
Fig. 7. Gclc deficiency impairs B cell-mediated immune responses in vivo.
a Heatmap showing relative expression of immunoglobulin level of 4d activated B6 FoB with increasing concentration of mitochondrial inhibitors and BSO. High concentration shown in brackets. Statistics are relative to nt. b Left: RT-qPCR of Gclc mRNA in B6 FoB at 0 or 24h after activation in vitro with anti-IgM, CD40 ligand and IL-4. Right: Luminescence-based quantitation of intracellular ROS in resting and 24h stimulated B6 FoB (n = 3 animals examined over two independent experiments). c Titers of IgM (left) and IgG (middle and right) in serum of LCMV Cl13-infected Gclcfl/fl and Gclcfl/fl Mb1-Cre+ mice as measured by ELISA at the indicated time points (n = 7 animals examined over 3–5 independent experiments). d LCMV Cl13 viral titers in the indicated organs of LCMV Cl13-infected Gclcfl/fl and Gclcfl/fl Mb1-Cre+ mice as measured by plaque assay at the indicated time points (n = 7 animals examined over 3–5 independent experiments). e Representative contour plot (left) and quantitation (right) of GC B cells (gated as in Supplementary Fig. 1a) in spleens of Gclcfl/fl and Gclcfl/fl Mb1-Cre+ mice as measured by FACS on day 12 post-LCMV Cl13 infection (n = 3 animals examined over two independent experiments). f Survival curve of Gclcfl/fl and Gclcfl/fl Mb1-Cre+ mice upon infection with VSV (n = 7 animals examined over two independent experiments). g Titers of neutralizing IgM and/or IgG antibodies against VSV-G protein in serum of Gclcfl/fl and Gclcfl/fl Mb1-Cre+ mice as measured by ELISA at the indicated time points (n = 7 animals examined over two independent experiments). Dotted/dashed lines represent the detection limit of the assay. For all applicable figure panels, data are mean ± SD and each dot represents one single mouse, except for (a), (c), (d), (f) and (g), where each panel or dot represents the mean of 3–7 mice. In contour plots, numbers represent percentages of the cells gated. Significance (P) was calculated with 2 way ANOVA, except for b and e (unpaired t-test) and f (log-rank test). *P ≤ 0.5; **P ≤ 0.01; ***P ≤ 0.001; ****P ≤ 0.0001.

