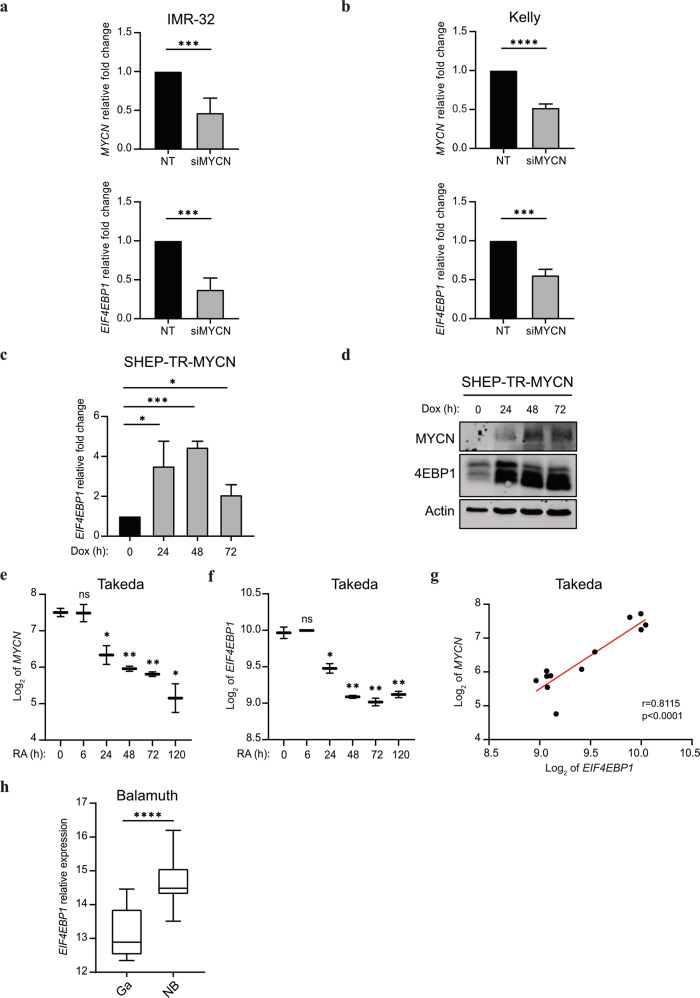
Fig. 5. EIF4EBP1 expression is regulated by MYCN in NB.
a, b Relative MYCN and EIF4EBP1 mRNA levels upon siRNA-mediated knockdown of MYCN in the MYCN-amplified IMR-32 (a) and Kelly (b) cell lines, as measured by qRT-PCR. c, d SHEP-TR-MYCN cells were treated with doxycycline (1 µg/ml) for the indicated times; EIF4EBP1 mRNA levels were determined by qRT-PCR (c) and levels of MYCN and 4EBP1 proteins were monitored by immunoblot using the indicated antibodies (d). The different 4EBP1 bands correspond to different phosphorylated forms of 4EBP1. e, f Expression levels of MYCN (e) or EIF4EBP1 (f) mRNA in SH-SY5Y cells treated with RA for the indicated times (Takeda’s dataset, n = 2 for each time point; [60]). Statistics were calculated for each time point compared to the control 0 h time point. g Expression levels of EIF4EBP1 mRNA plotted against expression levels of MYCN mRNA in SH-SY5Y cells treated with RA (Takeda’s dataset, n = 2 for each time point; [60]). h Relative EIF4EBP1 mRNA expression in healthy control tissues (ganglia, n = 9) and NB tumors (n = 26) of a TH-MYCN transgenic mouse model of NB (Balamuth’s dataset; [47]). Data were retrieved from the R2: Genomics Analysis and Visualization Platform. Statistics were determined using Student’s t test or Mann–Whitney U-test. Exact p-values are presented. *P < 0.05, **P < 0.01, ***P < 0.001, ****P < 0.0001.

