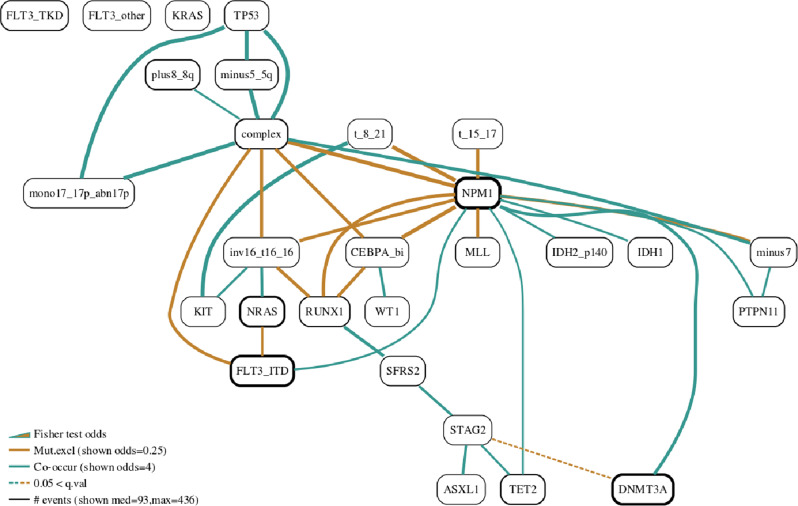
Fig. 3. AML Bayesian network with edges visualised based on Fisher’s exact test.
Edges with Fisher’s exact test colours and width. To help convey more information in a succinct way, we colour edges according to the direction of the exact test result among the two mutational vectors connected by the edge. Also, the width is proportional to the odds value of the same test. It is worth noting that these quantities are not derived from the network construction algorithm, but from pairwise testing. Fisher test edges are shown for the AML Bayesian network (μ = 60, ϵ = 7).

