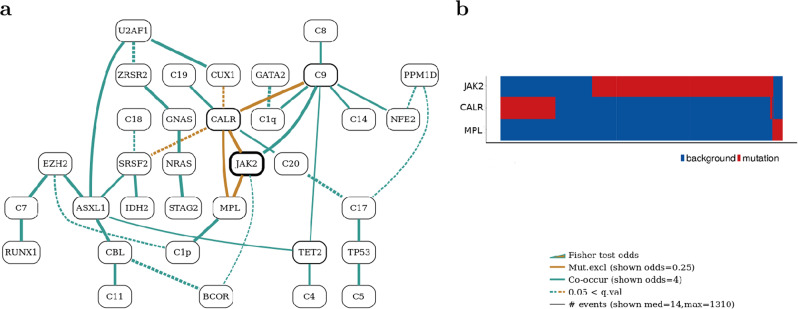
Fig. 5. Bayesian network for the MPN dataset.
a Bayesian network constructed for the MPN dataset (μ = 5, ϵ = 3) along with b the heatmap for the MPL family. The heatmap plots presence (red) or absence (blue) of driver events for the three members of the family (CALR, JAK2 and MPL) on the y-axis against patients on the x-axis. The heatmap, thus provides a visual aid in establishing the type of relation between these genes in the dataset. The BN captures the mutual exclusivity relationship of the three major players accounting for the majority of cases: CALR, JAK2 and MPL.

