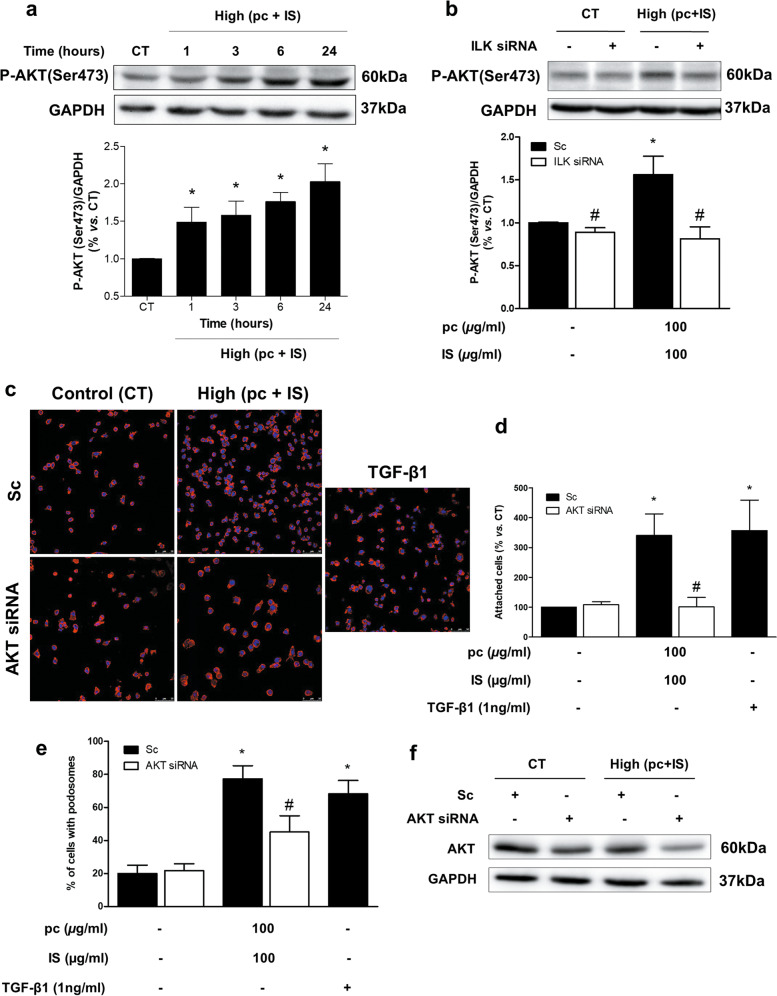
Fig. 7. Molecular mechanism downstream of ILK activation.
a THP-1 cells were incubated with high concentrations of p-cresol (pc) plus indoxyl sulfate (IS) for different times. b THP-1 cells were transfected with scrambled RNA (Sc) as a control (CT) (black bars) or were depleted of ILK with specific siRNA (white bars). Afterward, the cells were incubated with high concentrations of pc plus IS for 3 h. a, b Representative Western blots of AKT phosphorylated on the serine-473 residue (P-AKT) are shown. GAPDH was used as the endogenous control. The bars represent the normalized densitometric values of the blots against the endogenous control values. c–f THP-1 cells were transfected with scrambled RNA (Sc) as a control (CT) (c upper microphotographs, d, e black bars) or were depleted of AKT with specific siRNA (c lower microphotographs, d, e white bars). Afterward, the cells were seeded on fibronectin-coated coverslips and incubated with high concentrations of pc plus IS. c Adhesion of THP-1 cells stained with phalloidin (red) and Hoechst 33342 (blue) to the fibronectin matrix was determined by fluorescence confocal microscopy. The results of a representative experiment are shown. Scale bar, 50 µm. d Bar graphs indicating the average percentage of attached THP-1 cells treated as in c. e Bar graphs showing the mean percentage of cells with podosomes per field of view for cells treated as in c. The results are expressed as a percentage of the number of untreated CT cells. All values are presented as the mean ± SEM from 3, 4, or 5 independent experiments. *P < 0.05 vs. CT; #P < 0.05 vs. Sc. TGF-β1 was used as a positive control. f Total AKT expression was measured by western blot analysis (AKT). GAPDH was used as the endogenous control.

