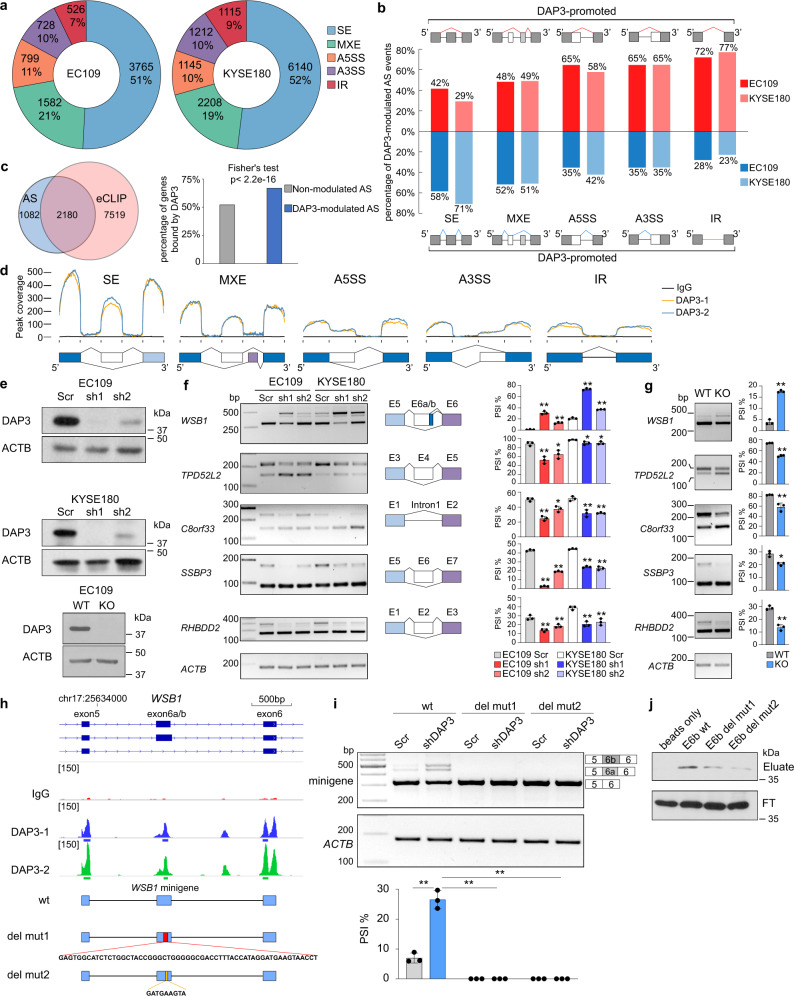
Fig. 2. DAP3 depletion leads to widespread splicing changes in cancer cells.
a Pie charts showing the distribution of each type of significantly altered splicing events in DAP3-depleted EC109 and KYSE180 cells compared to the scramble controls detected by rMATS15. SE skipped exon, MXE mutually exclusive exons, A5SS alternative 5’ splice site, A3SS alternative 3’ splice site, IR intron retention. b Percentage of DAP3-modulated splicing events demonstrating increased or decreased PSI upon DAP3 depletion in EC109 and KYSE180 cells. c Venn diagram showing the numbers of genes which underwent DAP3-modulated splicing and genes containing DAP3 eCLIP peaks in EC109 cells. Bar chart showing the percentage of genes with or without DAP3-modulated splicing that are bound by DAP3 (two-sided Fisher’s Test). d The binned DAP3 eCLIP peak coverage across the splice junctions of five types of DAP3-modulated splicing events in EC109 cells. e Western blot analysis of DAP3 protein expression in the indicated DAP3 knockdown (KD, sh1, and sh2), knockout (KO) and their control [scramble (Scr) and wildtype (WT)] samples. f, g Semiquantitative RT-PCR analyses of five randomly selected DAP3-modulated splicing events. h IGV browser tracks of the DAP3 eCLIP peaks spanning exon 5–6 and intervening introns of WSB1 gene. Significant peaks are marked by blue and green bars. Schematic diagram illustrates the genomic fragments inserted into the wildtype (wt) and mutant WSB1 splicing minigenes. del mut1, lacking a 58 bp DAP3-binding sequence in exon E6a/b; del mut2, lacking a 9 bp DAP3-binding motif in exon E6a/b. i Semiquantitative RT-PCR analyses of splicing changes of exogenous WSB1 transcripts derived from the indicated minigenes in Scr control and DAP3-KD cells. j RNA pulldown assay detecting the binding of DAP3 to WSB1 exon E6b wt, del mut1, and del mut2 RNA probes. WB analysis of DAP3 proteins in RNA pulldown (eluate) products and flow-through (FT) fractions. f, g, i Data are represented as mean ± s.d. of n = 3 biologically independent samples. Statistical significance is determined by unpaired, two-tailed Student’s t-test (*p < 0.05, **p < 0.01). Exact p-values and source data are provided in Source Data file.

