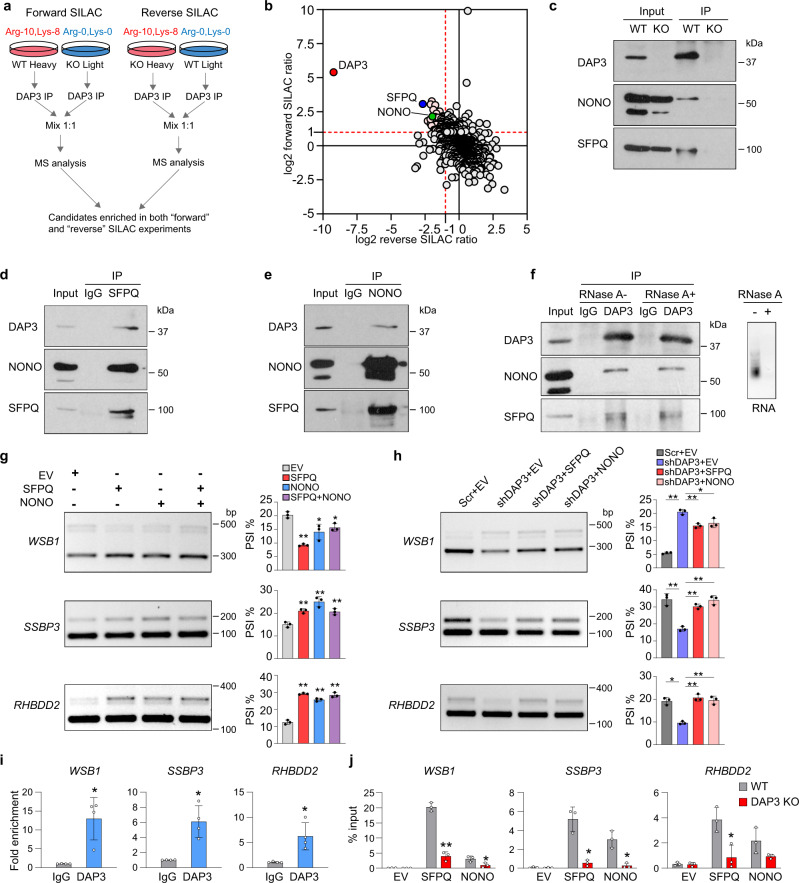
Fig. 3. DAP3 facilitates the binding of splicing factors SFPQ and NONO to target RNAs.
a Flowchart of the immunoprecipitation coupled to mass spectrometry (IP-MS) in combination with SILAC (stable isotope labelling with amino acids in cell culture) to detect DAP3 interactors. b Scatterplot of DAP3-immunoprecipitated proteins retrieved from both forward and reverse SILAC-based IP-MS. DAP3 and several top interactors (e.g., SFPQ and NONO) are highlighted. c Co-IP analysis of protein extracts from the WT and DAP3-KO EC109 cells. IP was performed with a DAP3 antibody, followed by western blot analysis of DAP3-pulldown products using DAP3, SFPQ, and NONO antibodies. d, e Co-IP analysis of protein extracts from EC109 cells. IP was performed with a SFPQ (d) or NONO (e) antibody, followed by western blot analysis of SFPQ or NONO-pulldown products using the indicated antibodies. IgG antibody was used as negative control. f Co-IP analysis of protein extracts from EC109 cells. RNase A treated (RNase A+) or untreated (RNase A−) protein lysates were used for IP using DAP3 antibody, followed by western blot analysis of DAP3-pulldown products using the indicated antibodies. IgG antibody was used as negative control. Agarose gel demonstrating the successful digestion of total RNA. g Semiquantitative RT-PCR analyses of the indicated splicing events upon overexpression of SFPQ or NONO alone or together in EC109 cells. h Semiquantitative RT-PCR analyses of the indicated splicing events upon overexpression of SFPQ or NONO in DAP3-KD EC109 cells. i RIP-qPCR analysis of the association between DAP3 protein and the indicated mRNA transcripts (WSB1, SSBP3, and RHBDD2). Data are represented as mean ± s.d. of n = 4 biologically independent samples. j RIP-qPCR analysis of the binding of SFPQ or NONO to the indicated mRNA transcripts in DAP3-KO and WT EC109 cells that were transfected with Flag-tagged SFPQ or NONO, respectively. RIP was conducted using anti-Flag M2 beads. g, h, j Data are represented as mean ± s.d. of n = 3 biologically independent samples. g–j Statistical significance is determined by unpaired, two-tailed Student’s t-test (*p < 0.05, **p < 0.01). Exact p-values and source data are provided in Source Data file.

