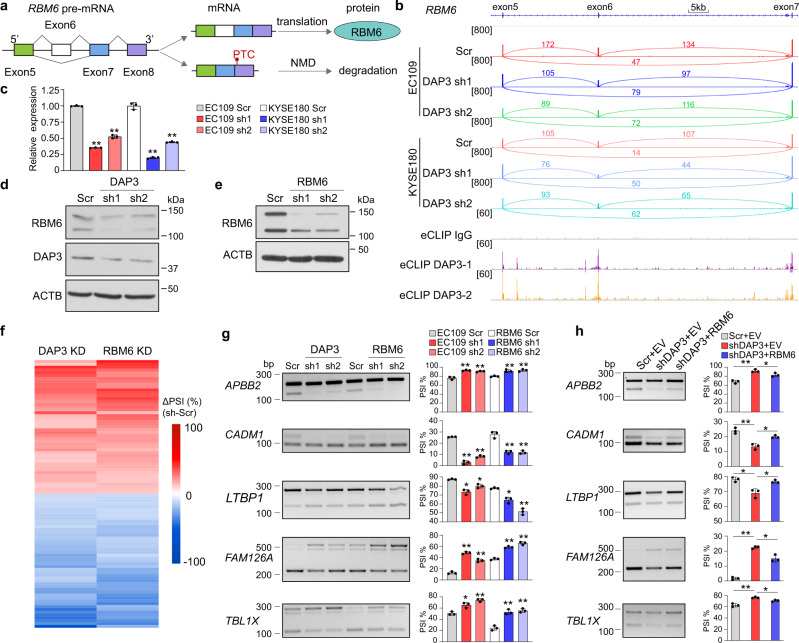
Fig. 5. DAP3 positively regulates RBM6 expression via repressing AS-NMD of RBM6.
a Schematic diagram depicting skipping of RBM6 exon 6 causes a shift in the open reading frame, resulting in the introduction of a PTC into RBM6 transcript and possible NMD. b Visualization of RNA-Seq data of DAP3-depleted EC109 and KYSE180 cells and DAP3 eCLIP-seq peaks spanning the RBM6 gene locus using IGV. Significant peaks are marked by purple and orange bars. c qRT-PCR analysis of expression of the RBM6 exon 6-included isoform after DAP3 depletion in EC109 and KYSE180 cells. ACTB was used as a housekeeping gene internal control. Data are represented as mean ± s.d. of technical triplicates. d Western blot analysis of RBM6 protein expression after DAP3 depletion in EC109 cells. e Western blot analysis of RBM6 protein expression after RBM6 knockdown in EC109 cells. f Heatmap showing the co-modulated splicing events upon knockdown of DAP3 and RBM6. g Semiquantitative RT-PCR analyses of five randomly selected splicing events co-modulated by DAP3 and RBM6. Data are represented as mean ± s.d. of n = 3 biologically independent samples. h Semiquantitative RT-PCR analyses of the indicated splicing events after re-expressing RBM6 in DAP3-depleted cells. Data are represented as mean ± s.d. of n = 3 biologically independent samples. c, g, h statistical significance is determined by unpaired, two-tailed Student’s t-test (*p < 0.05, **p < 0.01). Exact p-values and source data are provided in Source Data file.

