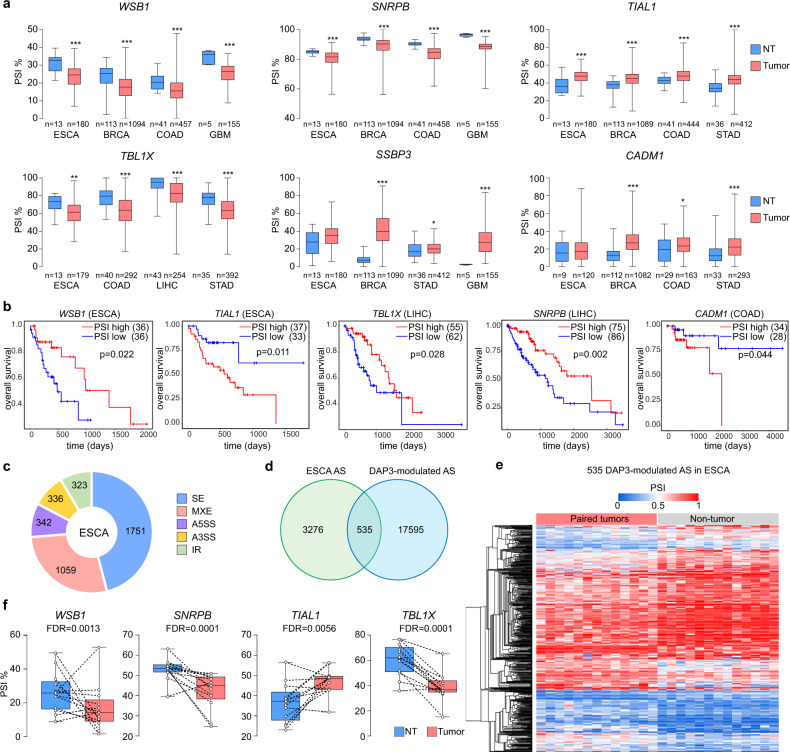
Fig. 6. Clinical relevance of DAP3-modulated mis-splicing in multiple cancer types.
a Boxplots showing the PSI values of six experimentally validated DAP3-modulated splicing events in tumors and their matched NT samples of six representative TCGA cancer types including esophageal carcinoma (ESCA), breast invasive carcinoma (BRCA), colon adenocarcinoma (COAD), glioblastoma multiforme (GBM), liver hepatocellular carcinoma (LIHC), and stomach adenocarcinoma (STAD). Statistical significance was determined by two-tailed nonparametric Mann–Whitney test (*p < 0.05, **p < 0.01, ***p < 0.001). b Kaplan–Meier OS plots comparing patients demonstrating the top 25th percentile of PSI values of the indicated DAP3-modulated splicing events (“PSI high” group) and those with the bottom 25th percentile of PSI values (“PSI low” group). Statistical significance was determined by log-rank test. c Pie chart showing the distribution of each type of differentially spliced events in 13 matched pairs of ESCA tumors and their NT samples detected by rMATS analysis15. d Venn diagram showing the number of significantly altered spliced events identified by RNA-Seq analysis of both DAP3-depleted ESCC cells (EC109 and KYSE180) and the TCGA ESCA. e Heatmap showing 535 significantly altered DAP3-modulated splicing events detected in both ESCC cell lines and ESCA tumors as described in d. The heatmap was generated using hierarchical clustering of tumors and NT samples (average linkage and Euclidean distance used). The color spectrum indicates PSI values. f Boxplots showing the PSI values of four representative DAP3-modulated splicing events in 13 matched pairs of ESCA tumors and NT tissues. a, f The box extends from the 25th to 75th percentiles. The line in the middle of the box is plotted at the median. The whiskers indicate min to max. Exact p-values and source data are provided in Source Data file.

