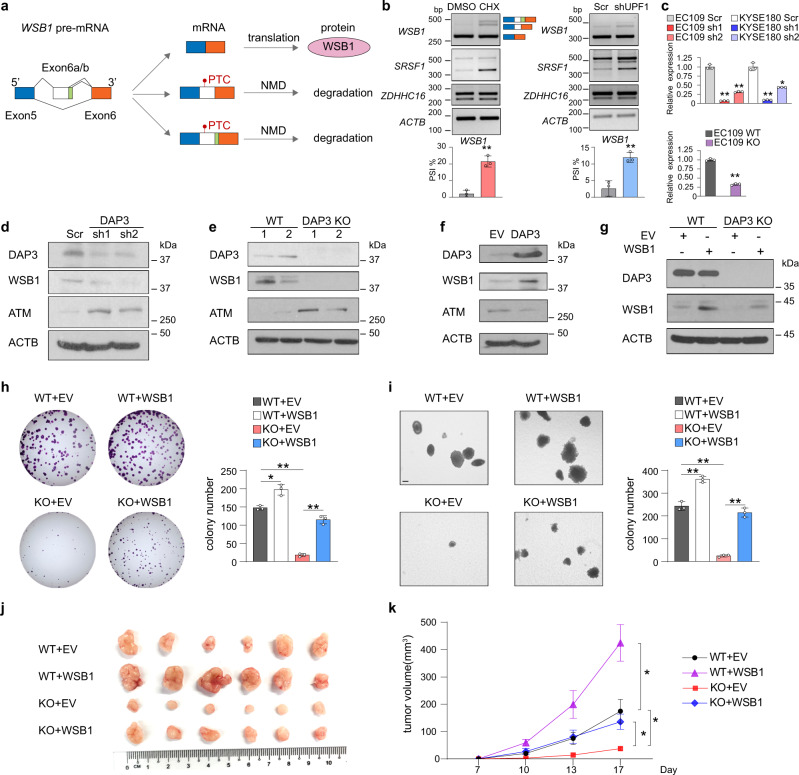
Fig. 7. DAP3 increases WSB1 expression via suppressing AS-NMD of WSB1 to promote tumorigenesis.
a Schematic diagram illustrating the inclusion of non-canonical exon E6a and E6b introduces a PTC to WSB1 mRNA transcript, which may result in NMD. b Semiquantitative RT-PCR analysis of the WSB1 splicing upon inhibition of NMD. Left panel: EC109 cells were treated with CHX or vehicle control (DMSO) for 6 h. Right panel: EC109 cells were transfected with shUPF1 or the scramble control (Scr) for 48 h. SRSF1 or ZDHHC16 serves as a positive or negative control, respectively, to ensure successful inhibition of NMD. ACTB was used as a housekeeping gene internal control. Data are represented as mean ± s.d. of n = 3 biologically independent samples. c qRT-PCR analysis of the change in expression of WSB1 canonical isoform (E6a/6b-skipped) upon DAP3-KD (upper panel) or KO (lower panel). ACTB was used as a housekeeping gene internal control. Data are represented as mean ± s.d. of technical triplicates. d–f Western blot analyses of DAP3, WSB1, ATM, and ACTB protein expression in d DAP3-KD EC109 cells, e DAP3-KO EC109 cells (“1” and “2” indicate two different WT or KO clones), and f EC109 cells with DAP3 overexpression. EV empty vector control. g Western blot analysis of DAP3 and WSB1 protein expression in DAP3-KO or WT EC109 cells that were overexpressed with the empty vector control or WSB1 construct. h, i Quantification of foci formation (h) or soft agar colony formation (i) induced by the indicated stable cells. Scale bar: 200μm. Data are represented as mean ± s.d. of n = 3 biologically independent wells. b, c, h, i Statistical significance is determined by unpaired, two-tailed Student’s t-test (*p < 0.05, **p < 0.01). j Xenograft tumors derived from the indicated stable cell lines at end point (n = 6 mice per group). k Growth curve of tumors derived from the indicated cells in mice, over a 17-day observation period. Data are presented as the mean ± s.e.m. Statistical significance is determined by unpaired, two-tailed Student’s t-test (*p < 0.05). Exact p-values and source data are provided in Source Data file.

