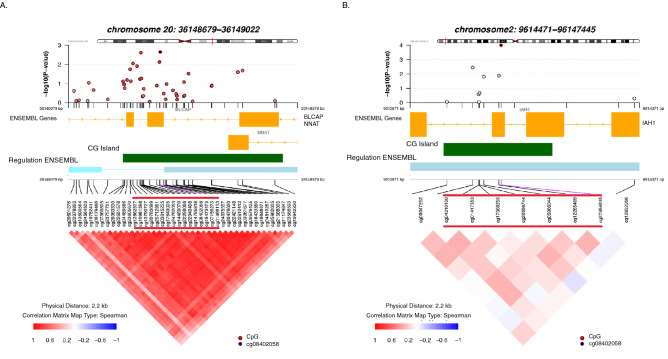
Figure 2.
Differentially methylated regions associated with left-handedness in meta-analysis. The figure represents the differentially methylated regions at P-adjusted < 0.05 in meta-analysis of DMR statistics across groups of NTR adults and ALSPAC adults (N = 3712). The top panel of each plot depicts the EWAS P-values for CpGs in the differentially methylated regions (A) at chromosome 20; and (B) at chromosome 2. The x-axis indicates the position in base pair (bp) for the region, while y-axis indicates the strength of association from meta-analysis EWAS with left-handedness (adjusted model). The middle panel shows the genomic coordinates (genome build GRCh37/hg19) and the functional annotation of the region: the ENSEMBL Genes track shows the genes in the genomic region (orange); the CpG Island track shows the location of CpG islands (green); the Regulation ENSEMBL track shows regulatory regions (blue). CpGs from DMR associated with left-handedness are indicated with red lines above the correlation heatmap. More detailed information on the regions is provided in Table 4. The bottom panel shows the Spearman correlation between methylation levels of CpGs in the window. The figure was computed using the R package coMET. See additional information on CpGs from the regions in Supplementary Table 12.

