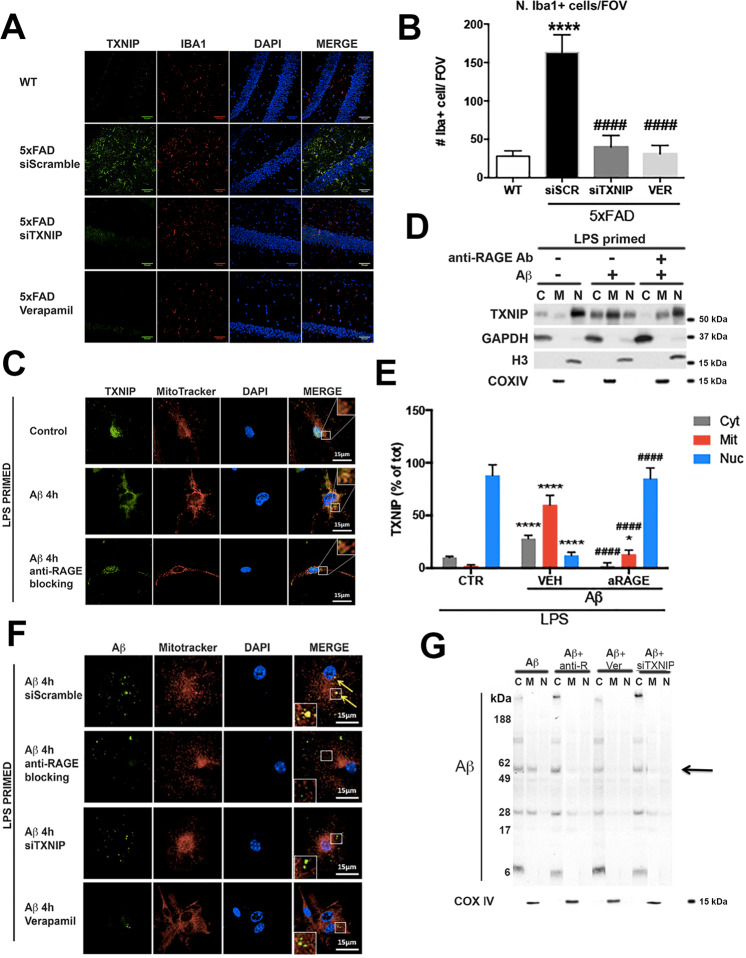
Fig. 2. RAGE–TXNIP axis role in Aβ-promoted microglia dysfunction.
A IHC analysis of TXNIP (green) and Iba1 (red) in 4 m old control and 5xFAD mice hippocampus treated as indicated. Nuclei are in blue (representative of n = 4). B Quantification of Iba1 positive microglia, expressed as cells per field of view (FOV) in WT and 5xFAD mice (Tg) treated as indicated. One-way ANOVA followed by Tukey’s multiple comparison test (****p < 0.0001 versus WT mice, ####p < 0.0001 versus 5xFAD mice treated with scrambled shRNA, n = 4). C IF analysis of TXNIP (green) and mitochondria (red), nuclei are in blue, in microglia treated as indicated (n = 5). D, E Subcellular fractionation, western blot analysis (D) and quantification (E) of TXNIP, GAPDH (cytoplasm), histone H3 (nucleus), Cox IV (mitochondria). One-way ANOVA followed by Tukey’s multiple comparison test (n = 5; ****p < 0.0001 versus control cells; ####p < 0.0001 versus cells treated with Aβ). F IF analysis of Aβ (green) and mitochondria (red) in microglia treated as indicated. Nuclei are in blue (representative of n = 5). G Subcellular fractionation and western blot of Aβ oligomers and Cox IV (representative of n = 4).

