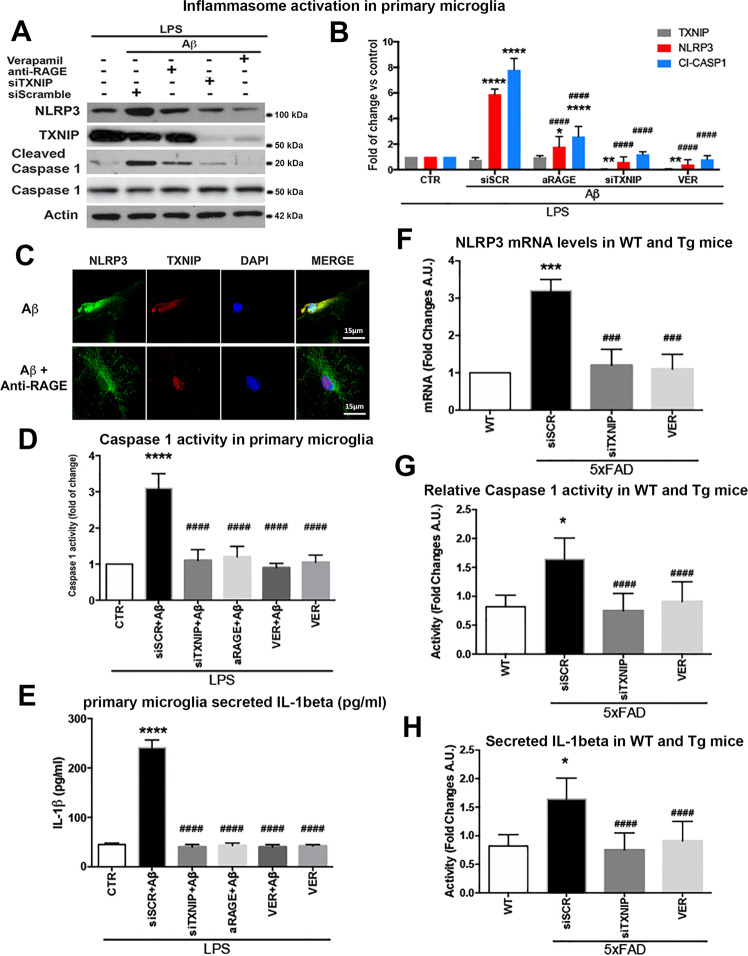
Fig. 5. RAGE–TXNIP axis is implicated in Aβ-induced NLRPS inflammasome activation.
A, B Western blot analysis (A) and quantification (B) of TXNIP, NLRP3, cleaved caspase-1 one-way ANOVA followed by Tukey’s multiple comparison test (n = 5; *p < 0.05, **p < 0.01, ****p < 0.0001 versus control; ####p < 0.0001 versus siScramble). Actin was used as loading control. C IF analysis of NLRP3 (green) and TXNIP (red), in microglia treated as indicated, nuclei are in blue (representative of n = 3). D Quantification of caspase-1 activity in microglia treated as indicated. One-way ANOVA followed by Tukey’s multiple comparison test (n = 5; ****p < 0.0001 versus control; ####p < 0.0001 versus siScramble). E ELISA of secreted Il-1β from the medium of microglia treated as indicated. One-way ANOVA followed by Tukey’s multiple comparison test (n = 6; ****p < 0.0001 versus control; ####p < 0.0001 versus siScramble). F RT-qPCR of GFAP mRNA in wt and 5xFAD (Tg) mice treated as indicated. One-way ANOVA followed by Tukey’s multiple comparison test (n = 3; ***p < 0.001 versus control; ###p < 0.001 versus siScramble). G Quantification of caspase-1 activity in wt and 5xFAD hippocampus of mice treated as indicated. One-way ANOVA followed by Tukey’s multiple comparison test (n = 4; *p < 0.05 versus control; ####p < 0.0001 versus siScramble). H ELISA of secreted IL-1β in wt and 5xFAD hippocampus of mice treated as indicated. One-way ANOVA followed by Tukey’s multiple comparison test (n = 4; p < 0.05 versus control; ####p < 0.0001 versus siScramble).

