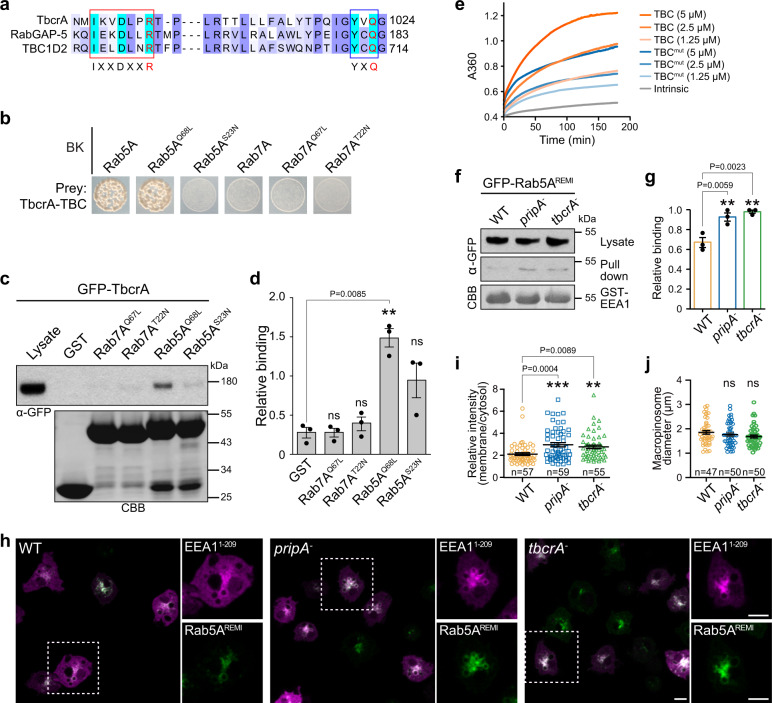
Fig. 7. The PripA-TbcrA complex promotes Rab5 inactivation.
a Sequence alignment of TbcrA, human TBC1D2, and human RabGAP-5, spanning the region with conserved motifs important for GAP activity. The conserved arginine and glutamine residues are highlighted in red. b Yeast two-hybrid assay showing specific interaction between TbcrA-TBC and the WT or CA form of Rab5A. c Top: Western blot from pull down of GST or GST-fused CA or DN forms of Rab5A and Rab7A beads with lysates expressing GFP-TbcrA. Bottom: the protein-transferred membrane was stained with CBB to show purified GST fusions. d Densitometry showing relative binding of GFP-TbcrA to different GST fusions (means ± SEM from three independent experiments). e Time courses of GTP hydrolysis by Rab5A in the absence or presence of TBC domain or TBC domain-containing mutations in the conserved arginine and glutamine residues (TBCmut). Graph shows one representative experiment. The catalytic efficiency was 802.2 ± 58.5 M−1s−1 for TBC domain and 357.2 ± 40.3 M−1s−1 for TBCmut (mean ± SEM from three independent experiments). f GST-EEA11-209 pull-down assays in GFP-Rab5AREMI/WT cells or the same cells with deletion of pripA or tbcrA. The pull-down samples and lysates were probed with anti-GFP antibody. The protein-transferred membrane was stained with CBB to show purified GST-EEA11-209. g Quantification of the relative binding of GFP-Rab5A to GST-EEA11-209 beads in different cell lines (means ± SEM from three independent experiments). h Localization of EEA11-209-RFP in GFP-Rab5AREMI/WT cells or the same cells with deletion of pripA or tbcrA. Magnified images of the areas indicated by dashed boxes are shown on the right. i Quantification of the fluorescent intensity of EEA11-209-RFP on the macropinosomal membrane relative to that in the cytosol. j Quantification of the maximum diameters of EEA11-209-RFP-marked macropinosomes. The scatter plots show data points with means and SEM. Significance was determined by one-way ANOVA with Dunnett posttest in all graphs. Scale bar = 5 μm. Source data for c–g, i, j are provided in this paper.

