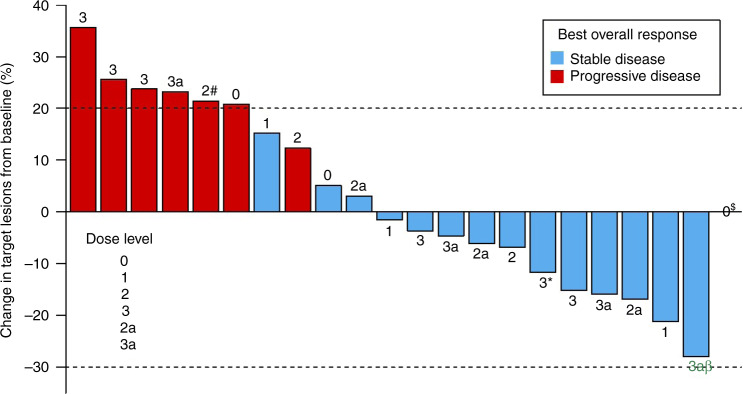
Fig. 2. Response to study treatment (n = 22).
Summary of the maximum reduction in the sum of target lesion sizes. Dose level is indicated for each patient. $Patient in DL0 in the far right had no measurable disease. *This patient was replaced due to being enrolled under DL3 but treated at DL2. #This patient was replaced due to not having received 75% of Cycle 1 dosing. βThis patient had tumour shrinkage by 28%.

