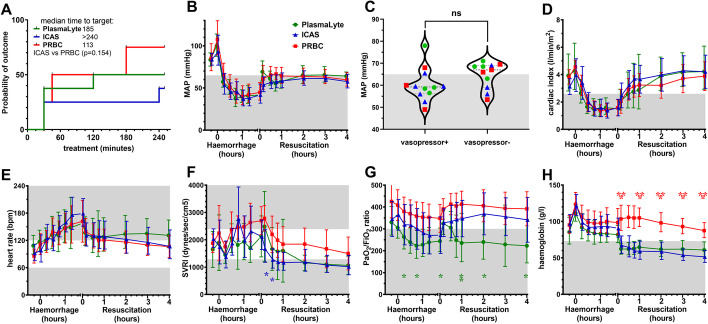
Fig. 2.
Primary and secondary haemodynamic outcomes. A Time to treat analysis of composite haemodynamic target (MAP ≥ 65 mmHg and CI ≥ 2.5 L/min/m2). B Mean arterial pressure (MAP). C Vasopressor use and MAP during the final treatment hour. D Cardiac index. E Heart rate. F Systemic vascular resistance index. G P/F ratio; and (H) haemoglobin. Shaded areas represent levels outside the normal range, or treatment targets. Data shown as mean or geometric mean according to normality test, with 95% confidence intervals. Mixed model ANOVA with Tukey correction for multiple comparisons; *p < 0.05, **p < 0.01, ***p < 0.001

