Figure 3.
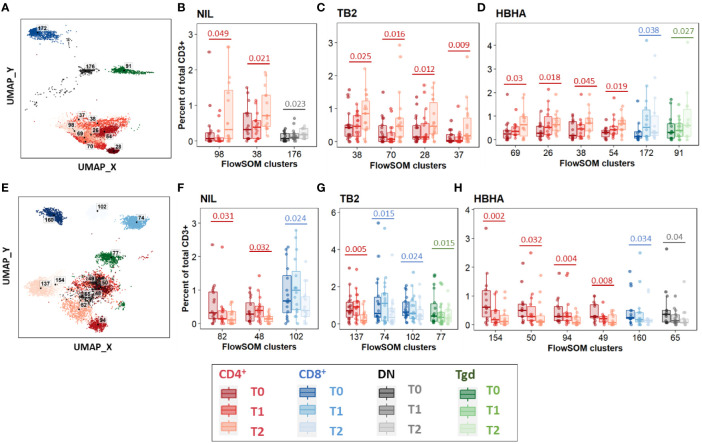
Significant abundance changes in non-canonical T-cell subsets throughout TB treatment. FlowSOM cluster abundance was analyzed over time in unstimulated or Mtb-stimulated samples (TB2 or rmsHBHA). Only clusters within which significant abundance changes were detected were displayed. Number of matched data points per timepoint for all panels: NIL: n = 16. TB2: n = 18. rmsHBHA: n = 14. Data are represented as medians + interquartile range. (A–D). Significantly increased clusters at treatment completion (T2) compared to treatment initiation (T0). Clusters within which a significant increase was detected between T0 and T2 were visualized on the reference UMAP shown in Figure 3 (A). Cluster abundance quantification was was performed in unstimulated (B), TB2-stimulated (C) or rmsHBHA-stimulated samples (D). (E–H) Significantly decreased clusters at treatment completion (T2) compared to treatment initiation (T0). Mapping (E) and abundance quantification of clusters which increased between T0 and T2 in unstimulated (F), TB2-stimulated (G) or rmsHBHA-stimulated samples (H). DN, double negative CD4- CD8-; Tgd, gamma delta T-cells. Statistical analysis: Friedman rank sum test and Wilcoxon-Nemenyi-Thompson post-hoc for pairwise comparisons between non-independent observations at T0, T1, and T2. Exact, unadjusted p-values are indicated on the figures. Benjamini-Hochberg corrections for multiple comparisons were performed as an indication and were not used for cluster selection for phenotype analyses in order to minimize type II errors. Adjusted p-values did not reach significance. All adjusted p-values and complete test statistics are available in Supplementary Table 5 .

