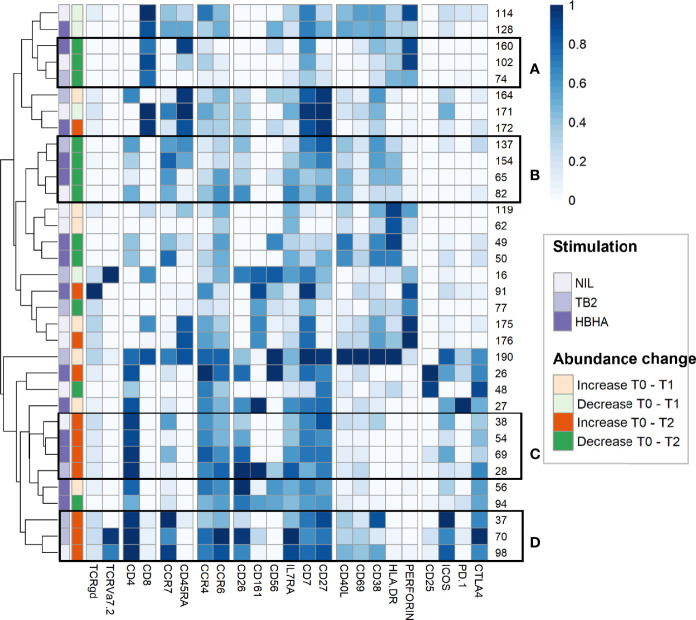
Figure 4.
In-depth phenotyping shows differential involvement of effector and memory T-cells in cluster abundance changes during TB treatment. Mean marker expression levels were visualized using heatmapping for cell cluster which increased (orange color code) or decreased (green color code) throughout treatment. Each line represents one cell cluster. Scales indicate normalized mass signal intensity. Hierarchical clustering was performed based on marker expression levels, regrouping cell clusters of similar immunophenotypes. Black rectangles annotated from (A–D) indicate cell cluster subgroups with both similar abundance changes and similar immunophenotypes (i.e. at least same main T-cell subset).

