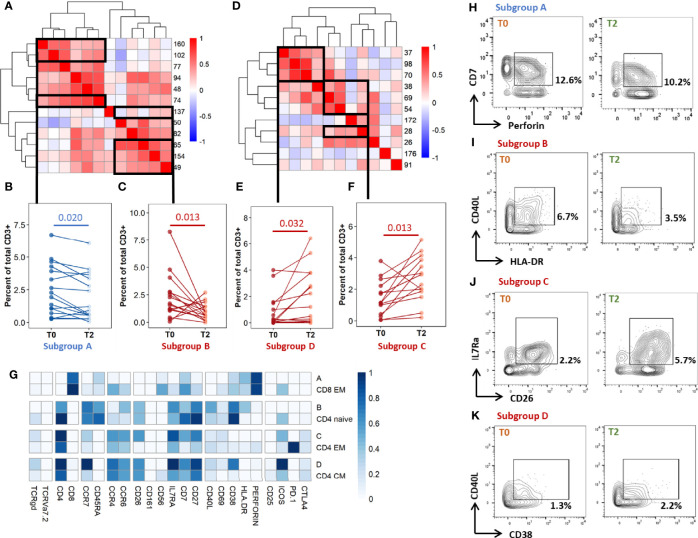
Figure 5.
Individual immunoprofiling confirms differential abundance of correlated subsets in cured patients after treatment. Cluster were stratified by type of significant abundance change: enrichment (A-C) or depletion (D-F) after treatment completion. (A, D) Pearson’s correlations were calculated on cluster abundance at T0 and displayed on a heatmap with hierarchical clustering. Clusters with similar immunophenotypes ( Figures 3 , 4 ) and positive correlation coefficients were grouped. Estimates of effect sizes are in Supplementary Tables 6, 7 . (B, C, E, F) The abundance of each subgroup was visualized. Each dot represents data for one patient. Statistical analysis: Friedman rank sum test. Subgroup A: data from rmsHBHA samples (n =14), clusters 74, 102, 160; p = 0.020, Fchisq = 5.4. Subgroup B: data from unstimulated samples (n =16), clusters 137, 154, 65, 82; p = 0.0013, Fchisq =10.3. Subgroup C: data from unstimulated samples, clusters 38, 54, 69, 28; p = = 0.0013, Fchisq = 10.2. Subgroup D: data from rmsHBHA samples, clusters 37, 70, 98; p = 0.032, Fchisq = 4.57. (F) For each subgroup, normalized mean marker expression levels were compared with similar T-cell subsets. (G–K) Manual gating analysis was performed to verify unsupervised results (representative plots, 500 to 1,000 events). Numbers indicate the percentage of gated cells among total CD3+ cells. Subgroup A: CD3+CD8+CCR7-CD45RA-CD7+Perforin+. Subgroup B: CD3+ CD4+CCR7+CD45RA-CCR6+IL7Ra+CD27+CD40L+CD38+HLA-DR+. Subgroup C: CD4+CCR7lowCD45RA-CCR4+CCR6+ CD26+IL7Ra+CD7+CD27+. Subgroup D: CD4+CCR7+CD45RA-CCR4+CCR6+CD26+IL7Ra+CD7+CD27+ CD38+.

