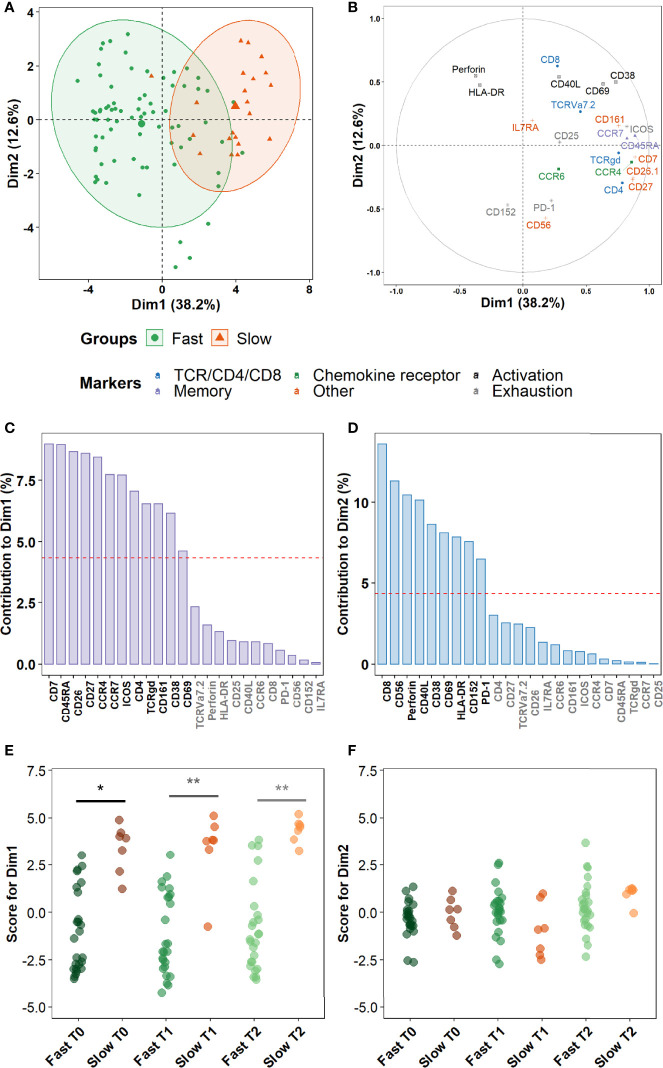
Figure 7.
Non-lineage markers discriminate slow and fast responders within differentially abundant subsets. Principal Component Analysis (PCA) was performed on marker expression data from the clusters identified in Figure 6 , within 96 Mtb-stimulated samples matched at T0, T1, and T2 (TB2: 54 samples; rmsHBHA: 42 samples; see Supplementary Table 1 for sample number details). (A) Explanation of the variance between fast converters (25 samples at each timepoint) and slow converters (7 samples at each timepoint). Axes represent the principal components 1 (Dimension 1, Dim1) and 2 (Dim2). Percentages indicate their contribution to the total observed variance. Axis values represent individual PCA scores. Concentration ellipses correspond to 90% data coverage. (B) Contribution of cellular markers to the variance described by Dim1 and Dim2. Axis values represent marker PCA scores. Color codes represent broad marker functions. (C, D) Quantification of (B) for Dim1 (C) and Dim2 (D). Contributions of each marker are expressed as a percentage of the dimensions. The dashed line corresponds to the expected reference value if each marker contributed uniformly to the variance. Markers indicated in gray are below this reference value. (E, F) Distribution of individual PCA score values according to the culture conversion group at each timepoint, for Dim1 (E) and Dim2 (F). Wilcoxon Rank Sum Test. *p < 0.05. **p < 0.001. Exact p-values and test statistics are in Supplementary Table 9 .

