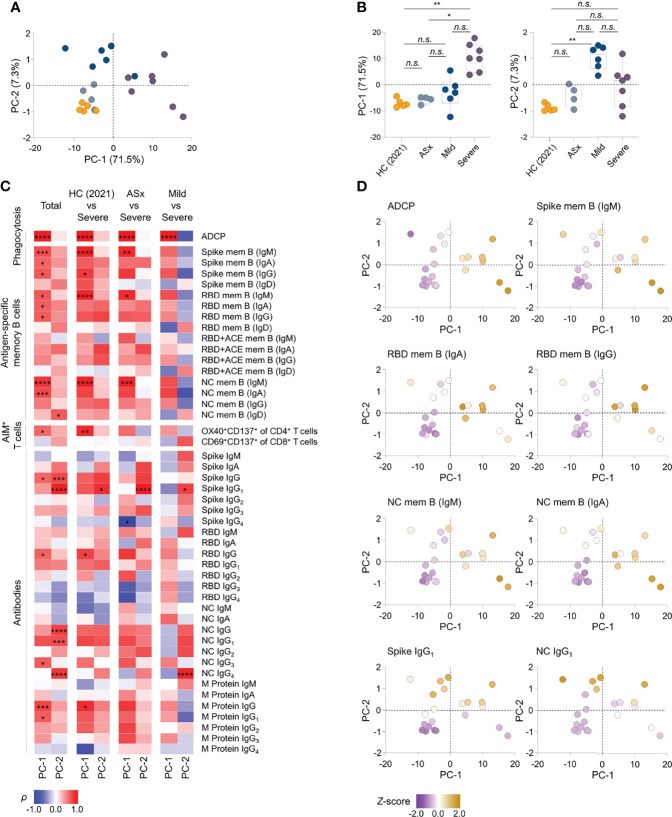
Figure 5.
Integrated analysis of immune components to SARS-CoV-2 according to the severity. (A) Principal component analysis (PCA) of aggregated immune responses data against SARS-CoV-2, namely, circulating Abs against SARS-CoV-2 proteins, the Ab-dependent phagocytic capability of plasma, and frequencies of antigen-specific memory cells over disease severity of illness from PBMCs collected at 12 months in patients and healthy subject. HC (2021): healthy control (n = 5), ASx: asymptomatic (n = 4), Mild (n = 6), Severe (n = 7). (B) Summary boxplots of PC-1 and PC-2 scores over disease severity of illness. Statistics were calculated using non-parametric ANOVA with correction for multiple comparisons using statistical hypothesis testing (Dunn’s test) (n.s.: P > 0.05, *P < 0.05, **P < 0.01, ***P < 0.001). Boxplots represent median with interquartile range. (C) Correlations of antigen-specific immune responses against the PC-1 and PC-2, displaying contributions of 47 immune components to PC-1 and PC-2 in group comparisons. The color represents Spearman’s rank correlation coefficient (ρ); red color indicates positive correlations, and blue indicates negative correlations among patient groups of disease severity. Statistics were adjusted using Bonferroni correction in the consideration of multiple statistical hypothesis n.s.: adj. P >0.05, * adj. P < 0.05, ** adj. P < 0.01, *** adj. P < 0.005, **** adj. P < 0.001. (D) Representative scatter plots displaying the relative levels of selected features onto PC space. The color represents z-score of each feature according to heat scale ranges from purple (low) to yellowish brown (high) color. PC-1, principal component-1; PC-2, principal component-2; mem B, memory B cells.

