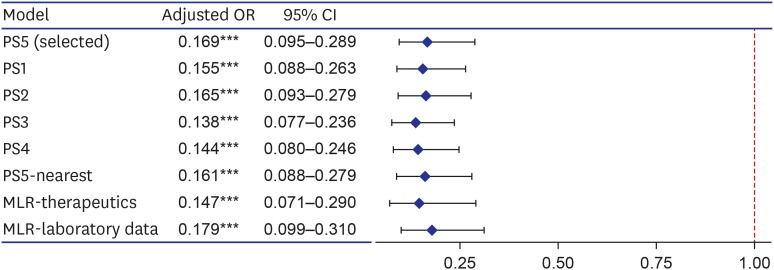
Fig. 2. Forest plot for effects of regdanvimab on composite outcome of death, or disease aggravation in sensitivity analyses. Sensitivity analyses were performed by changing the covariates included in the PS estimation model (PS1–5), changing the matching method (PS5-nearest), and adding covariates in the multivariable logistic regression model of analyzing the matching data (MLR-therapeutics and laboratory data). The covariates included in each PS estimation model are as follows; PS5 included variables corresponding to the regdanvimab administration criteria of European Medicines Agency and gender according to clinical judgment (age, sex, BMI, cardiovascular disease, chronic lung disease, diabetes mellitus, hypertension, chronic kidney disease, chronic liver diseases, and pneumonia); PS1 included all measured covariates (age, sex, BMI, cardiovascular disease, chronic lung disease, diabetes mellitus, hypertension, chronic kidney disease, chronic liver diseases, pneumonia, ACEIs/ARBs, statins, aspirin, and immunomodulators); PS2 included variables that were statistically significant for both exposure and outcome, and significant for outcome (age, cardiovascular disease, hypertension, chronic kidney disease, and pneumonia); For PS3, variables corresponding to the Korean regdanvimab administration criteria were included according to clinical judgment (age, cardiovascular disease, chronic lung disease, diabetes mellitus, hypertension, and pneumonia); PS4 included variables of PS3 and what significant for outcome (age, cardiovascular disease, chronic lung disease, diabetes mellitus, hypertension, chronic kidney disease, and pneumonia). PS5-nearest was the result of performing nearest matching by designating a caliper, which was 0.094 (0.2 of the standard deviation of the logit of the PS). MLR-therapeutics was the result of adding other treatment exposures (azithromycin, corticosteroids, hydroxychloroquine, lopinavir/ritonavir, and remdesivir), and MLR-laboratory data was that of adding the baseline laboratory data (C-reactive protein, lactate dehydrogenase, D-dimer, troponin I, ferritin, and creatine kinase).
OR = odds ratio, CI = confidence interval, PS = propensity score, MLR = multivariable logistic regression, BMI = body mass index, ACEI = angiotensin-converting enzyme inhibitor, ARB = angiotensin-receptor blocker.
Variables of significance (***P < 0.001).

