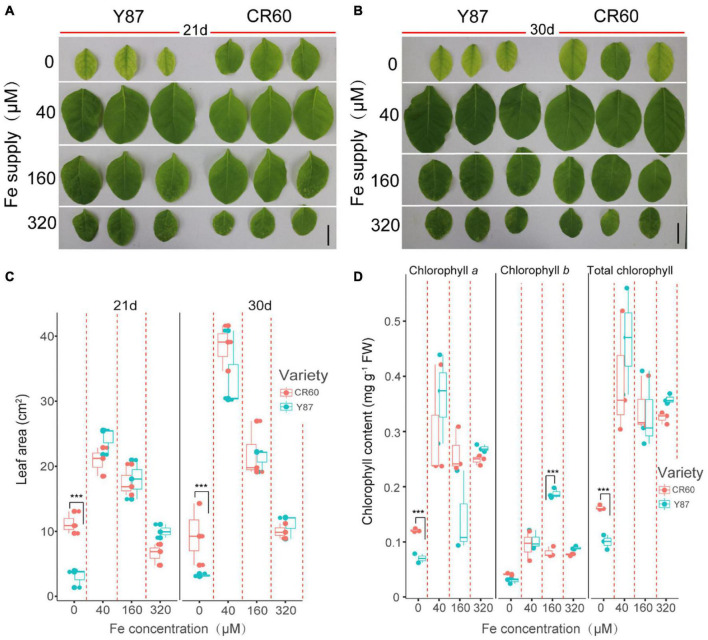
FIGURE 2.
CR60 had higher iron deficiency tolerance than Y87. Images (A,B), leaf area (C) and chlorophyll concentrations (D) of the first fully expanded apical leaves of CR60 and Y87 after growing at different nutrient solution concentrations of iron (0, 40, 160, and 320 μM) for 21 and 30 days. The experiment was conducted at least three times and showed similar results. For panels (C,D) data were collected from plants grown at differential iron supply for 21 days and were expressed as means ± SD (n = 3). Asterisks indicate statistically significant differences between CR60 and Y87 (***p < 0.001) as determined by the Student’s t-test.

