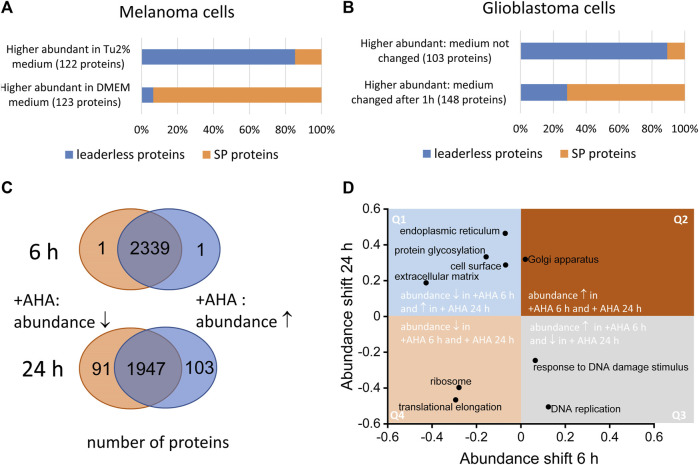
FIGURE 2.
Effect of cell culture conditions on the secretome. Both serum-free and serum containing approached might influence the composition of secretomes. (A) WM3918 melanoma cells (n = 3 dishes per group) were cultivated for 24 in serum free medium. Cells expanded in DMEM showed a significantly higher proportion (p-value 2.2E-16, Fisher’s exact test) of signal-peptide containing proteins (SP proteins) at higher abundances in secretomes, whereas in Tu2% medium based secreteomes, putative LLSP showed higher abundances in comparison to expansion in DMEM. (B) LN18 glioblastoma cells (n = 3 per group) were incubated for 24 h in serum-free medium. After 1 h, the medium was replaced in one set of samples. In this samples, signal peptide containing proteins showed higher intensities in resulting secretome samples whereas in samples in which the medium was not changed after 1 h, a significant higher proportion of putative LLSP could be found at higher intensities (p-value 2.2E-16, Fisher’s exact test). (C) Normal human dermal foreskin fibroblasts were cultured with azidohomoalanine (AHA) or methionine as control for 6 and 24 h (n = 5 dishes per group). After MS analysis, different abundant proteins were determined by the Student’s t-test based significance analysis of microarrays approach (Tusher et al., 2001). Whereas after 6 h only 2 proteins (of 2441 cellular proteins) showed a significant AHA induced abundance change, 194 proteins (of 2141 cellular proteins) showed an abundance change after 24 h (D). This dataset was also used for the analysis of global shifts in abundance on the level of proteins grouped by gene ontology annotations (Cox and Mann, 2012). Selected GOCC and GOBP categories are shown indicating the size of the abundance shift of associated proteins. Whereas proteins for some categories show an abundance change in the same direction after 6 and 24 h AHA incubation (found in quadrant Q2 and Q4), other protein groups show an AHA induced abundance shift in the opposite direction at the two timepoints (found in quadrant Q1 and Q3).

