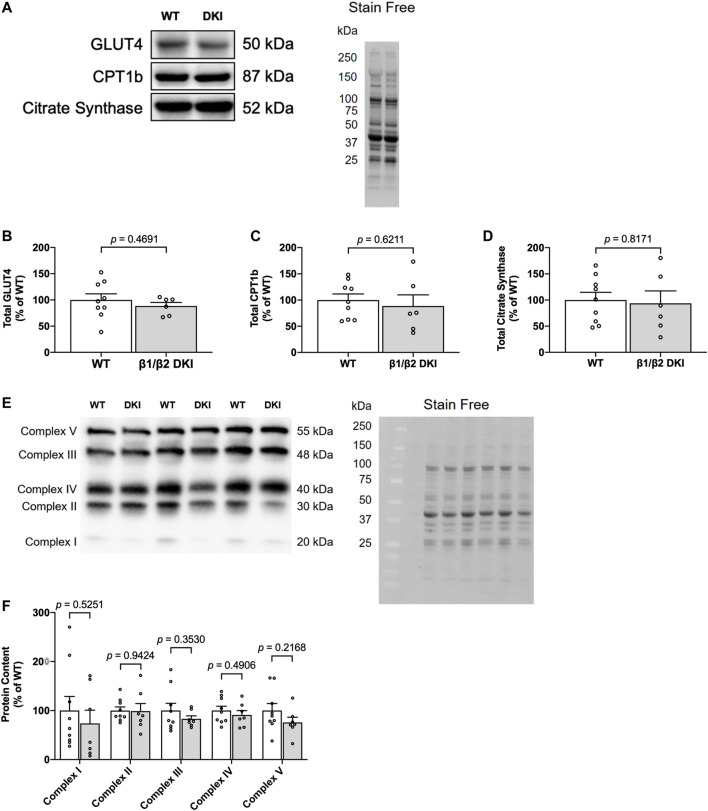
FIGURE 6.
DKI mouse skeletal muscle displays similar content of proteins associated with glucose uptake and protein markers of mitochondrial content relative to WT. (A) Representative immunoblots and stain free image of GLUT4, CPT1b, and citrate synthase in WT and DKI skeletal muscle; (B) Quantified total GLUT4; (C) Quantified total CPT1b; (D) Quantified total citrate synthase; (E) Representative immunoblots and stain free image of mitochondrial oxidative phosphorylation (OXPHOS) complex proteins in WT and DKI skeletal muscle; (F) Quantified OXPHOS complex protein content. Male mice, 20–32 weeks, n = 7–9.

