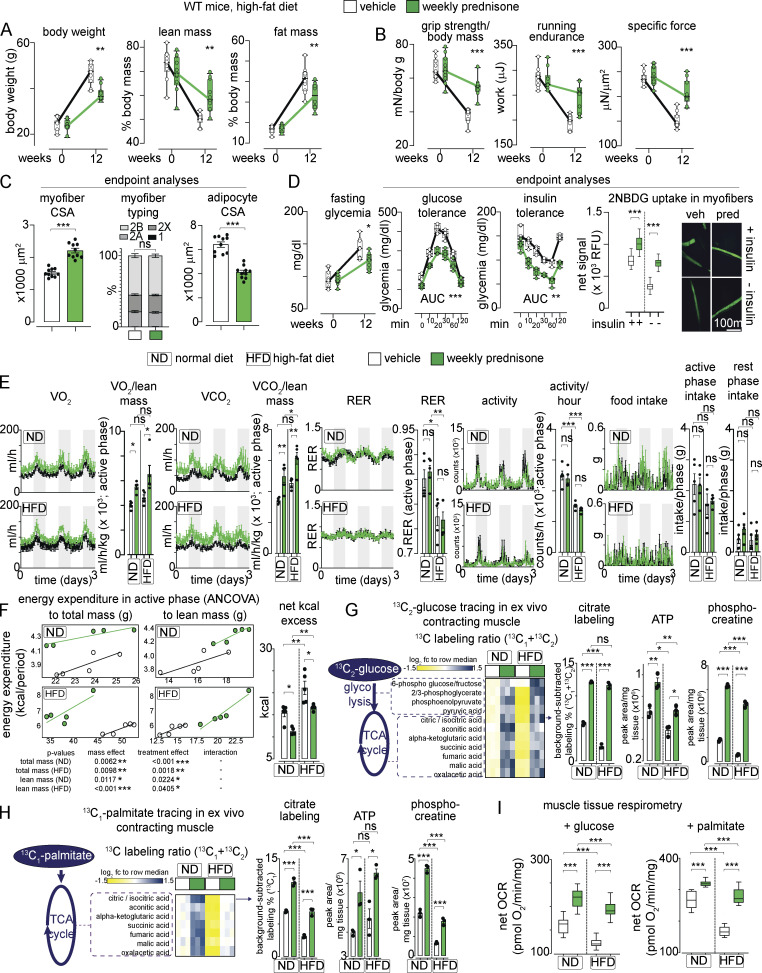
Figure 1.
Intermittent prednisone improves exercise tolerance in obesity. WT mice were fed a HFD for 12 wk and treated with weekly i.p. injections of either vehicle or 1 mg/kg prednisone. (A) During diet-induced obesity onset, treatment reduced accrual of body weight and fat mass, while improving lean mass retention. (B) Treatment increased strength, running endurance, and specific muscle force (tibialis anterior) after HFD regimen. (C) Treatment increased the average CSA of myofibers without significant changes in relative myofiber abundance in tibialis anterior muscle, while decreasing adipocyte CSA in white adipose tissue. (D) Treatment attenuated hyperglycemia and improved profiles from glucose tolerance and insulin sensitivity tests. Right: Isolated myofibers from treated mice showed increased capacity of 2NBDG (fluorescent glucose analog) uptake ex vivo. 2NBDG signal was normalized to signal from negative control myofibers (cytochalasin-treated). (E) Metabolic cage traces from mice on normal or HFD show that treatment increased overall metabolic rate, indicated by increased VO2 and VCO2, without significant effects on overall RER, activity, and food intake. (F) Treatment increased energy expenditure in the active phase as shown by ANCOVA analyses with total mass or lean mass as co-variates. Treatment reduced net calorie excess in both diets. (G) Isotope tracing in ex vivo contracting muscle showed that treatment increased glucose catabolism toward mitochondrial energy production in muscle, as shown by gain of 13C labeling of citrate and other intermediates of glycolysis and TCA cycle, as well as increased unlabeled levels of ATP and phosphocreatine in the same samples. (H) Analogous trends were obtained with 13C-palmitate. (I) Tissue respirometry on muscle biopsies showed that treatment increased basal respiration in the presence of either glucose or palmitate. Line plots, single values with min–max box-plots, and connected medians; histograms, single values and mean ± SEM box-plots, Tukey distribution. All panels report data verified in ≥2 independent experiments. n = 10 mice/group (A and B), 5 mice/group (C–F); 3 mice/group (D and E). *, P < 0.05; **, P < 0.01; ***, P < 0.001; A–C (myofiber typing), D (glycemia): two-way ANOVA; C–I: one-way Welch’s ANOVA with Tukey multiple comparison.

