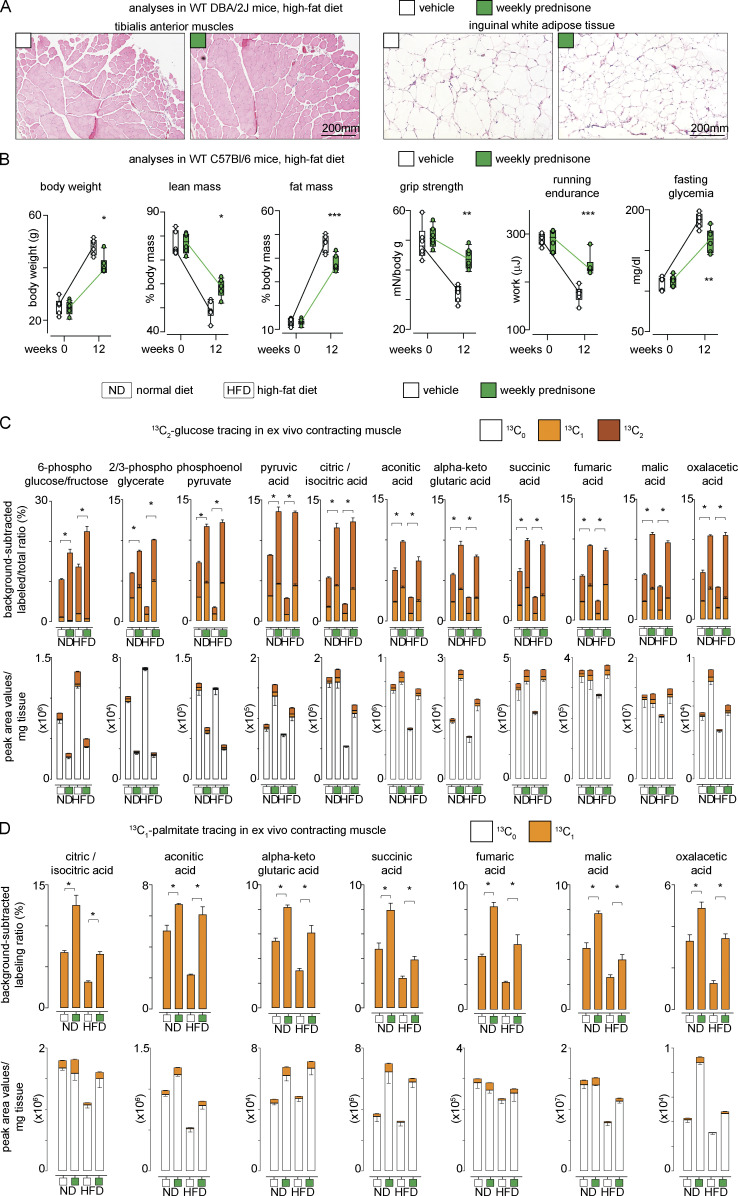
Figure S1.
Additional supporting data related to Fig. 1. (A) Representative histological images for CSA analyses presented in Fig. 1 C. (B) Weekly prednisone effects on adiposity, exercise tolerance and fasting glycemia were recapitulated in WT C57BL6/J mice. (C and D) Histograms of 13C labeling and total metabolite levels of analyses shown in Fig. 1, G–H heatmaps. Line plots, single values with min-max boxplots and connected medians; histograms, single values and mean ± SEM.; boxplots, Tukey distribution. All panels report data verified in at least two independent experiments. n = 5 mice/group (A), 3 mice/group (B and C). *, P < 0.05; **, P < 0.01; ***, P < 0.001; (B and C) two-way ANOVA; (D) one-way Welch’s ANOVA with Tukey multiple comparison.

