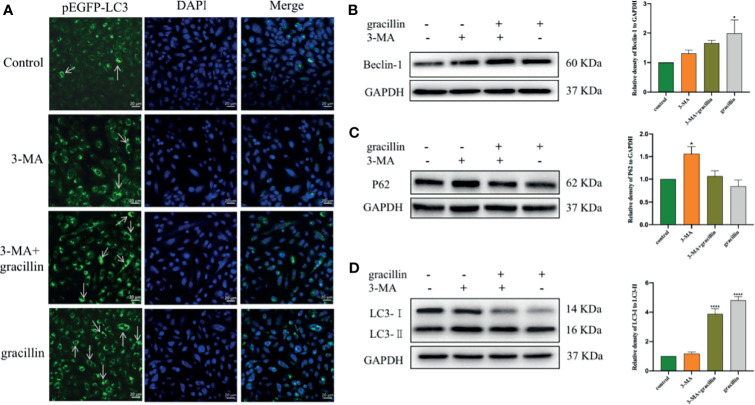
Figure 6.
After 3-MA inhibits autophagy, the effect of gracillin on the degree of autophagy in A549 cells and the protein expression of Beclin-1, P62, LC3-Iand LC3-. (A) Confocal laser image of gracillin-treated A549 cells. The nucleus was stained with DAPI. The arrow in the figure indicates the punctate aggregation of LC3 on the autophagosome membrane. One of the fluorescent punctation represents an autophagosome. (B) Western blot analysis of Beclin-1 and relative protein expression levels were quantified by normalization to GAPDH. (C) Western blot analysis of P62 and relative protein expression levels were quantified by normalization to GAPDH. (D) Western blot analysis of LC3 and relative protein expression levels are expressed as LC3-II/LC3-I. The full picture is in Supplementary Figure 3 . Compared with the control group, *P ≤ 0.05, ****P ≤ 0.0001.

