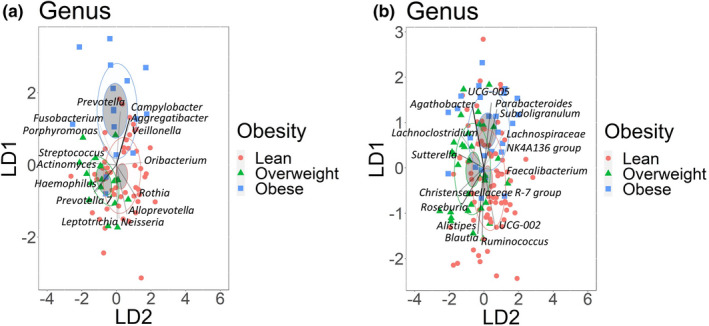
FIGURE 2.

Obese and lean groups can be characterized by the abundance of dominant bacteria genera. Linear discriminant analysis of the 15 most abundant bacterial genera identified in (a) Salivary samples (b) Fecal Samples. Obesity groups are represented by color, lean group by red, overweight group by green, and obese group by blue. The higher abundance of bacterial genera in the obesity groups is indicated by the direction of the vector rays. The intensity of vector rays’ color corresponds to the strength of the impact. Confidence ellipses are shaded. Normal data ellipses are unfilled and leveled to include 50% of the samples
