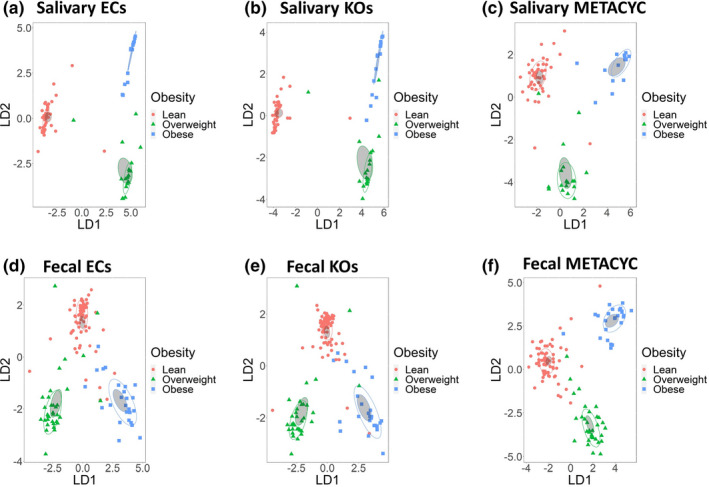
FIGURE 4.

Obesity groups can be discriminated by metabolic potential predicted by PICRUSt2. Linear discriminant analysis of relative abundances of (a) ECs inferred from saliva samples (b) KOs inferred from saliva samples, (c) MetaCyc pathways inferred from saliva samples, (d) ECs inferred from fecal samples, (e) KOs inferred from fecal samples, (f) MetaCyc pathways inferred from fecal samples. Obesity groups are represented by color, lean group by red, overweight group by green, and obese group by blue. Confidence ellipses are shaded. Normal data ellipses are unfilled and leveled to include 50% of the samples
