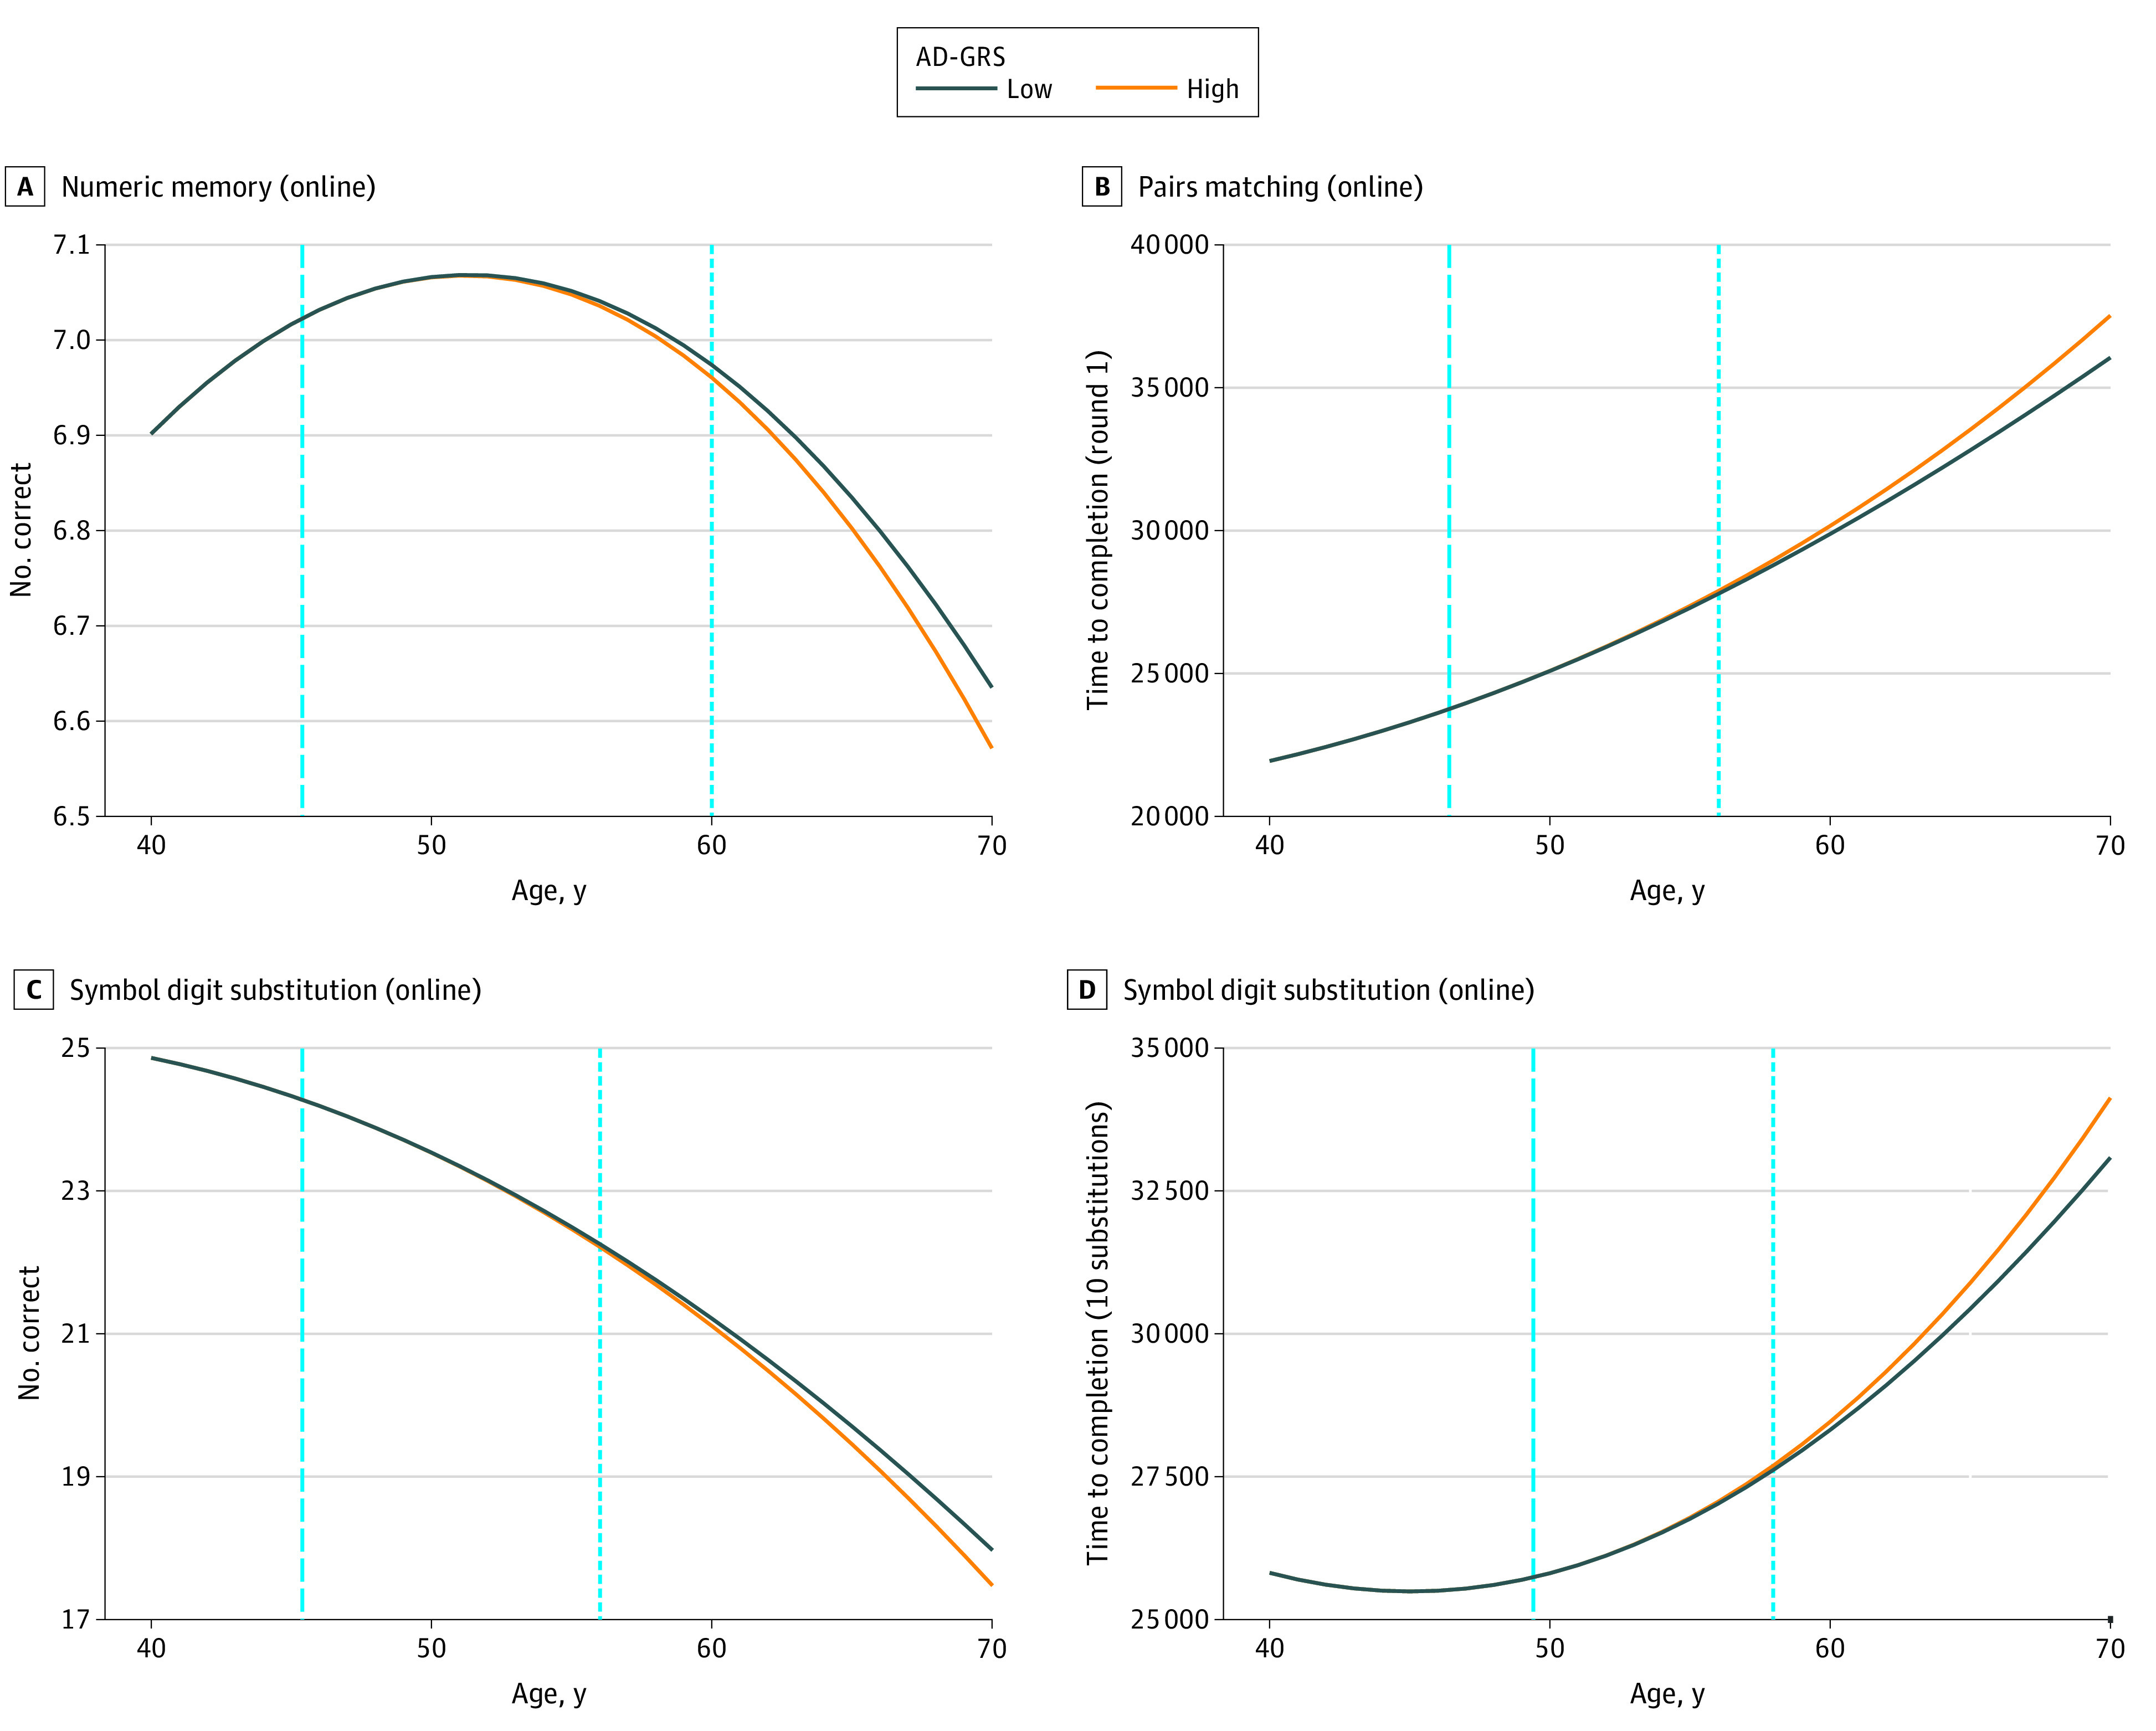
Figure 1. Divergence Model Results for 4 Cognitive Measures.

Plots of modeled mean cognition of 4 cognitive measures at higher (1.76) and lower (−1.22) z-scored Alzheimer disease genetic risk score (AD-GRS). Dashed vertical lines indicate threshold age at which the AD-GRS begins to be associated with the cognitive measure. At ages below the threshold, the AD-GRS does not interact with age to influence cognition. Dotted vertical lines indicate the earliest age at which the cognitive difference in the high and low AD-GRS groups are statistically detectable using a 1-sided, 2-sample t test (P ≤ .05). These curves were based on women with median values of the 10 principal components.
