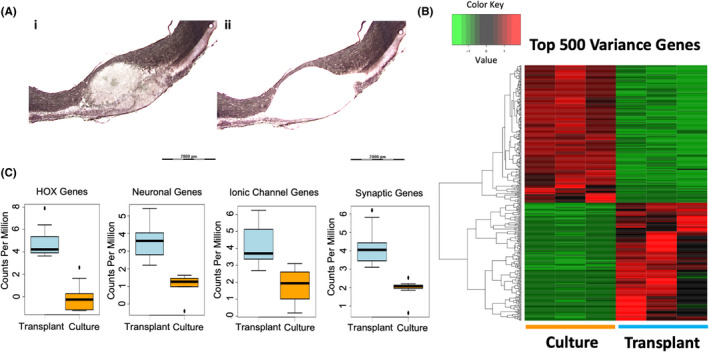
FIGURE 2.

Transplanted sNPCs mature in a contused rat cord. (Ai‐ii) Area of cell transplantation extracted via laser microdissection for RNA‐sequencing after Eosin Y/Nissl staining. Laser dissection of approximately 200 μm outside of the cell transplantation area for examining the impact of treating contused spinal cords with sNPCs. (B) Unsupervised hierarchical clustering showing distinct separation between transplanted cells and cultured cells. Read counts were normalized and log transformed. Hierarchical clustering was performed using Euclidean distances and average linkage clustering method. The first three and last three columns represent their respective replicates. (C) Expression profile alterations between HOX genes, neuronal genes, ionic channel genes and synaptic genes, respectively, between grafted and cultured sNPCs. The boxes show the 25th–75th percentile range, and the centre mark is the median. Whiskers show 1.5 times IQR from the 25th or 75th percentile values
