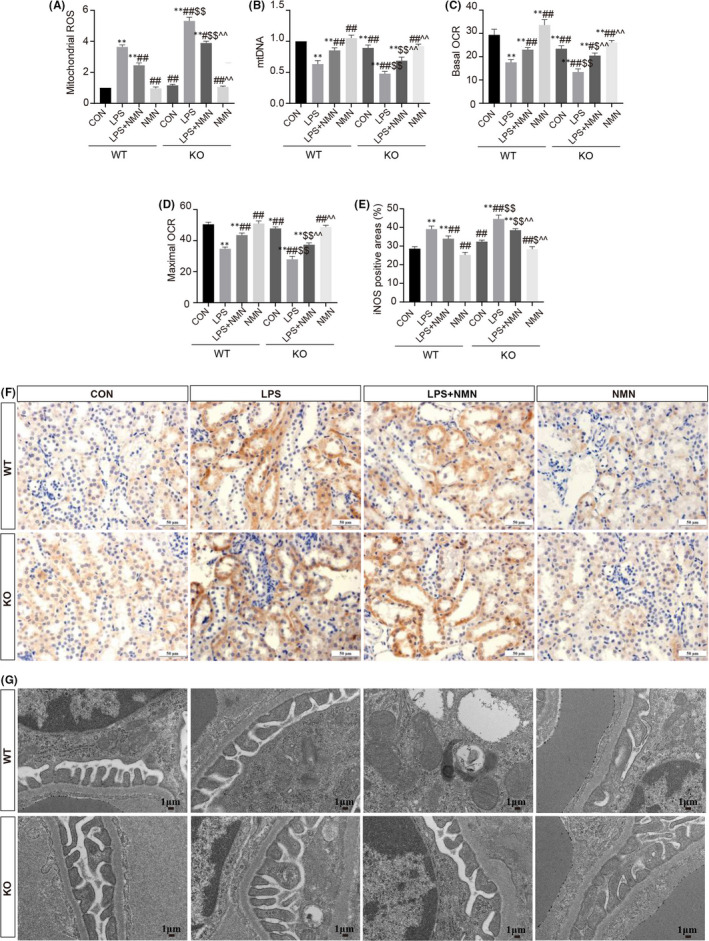
FIGURE 3.

NAD+ protects against LPS‐induced mitochondrial dysfunctions and oxidative stress. (A) Levels of mitochondrial ROS were determined using a commercial kit in each group. (B) qRT‐PCR analysis for mtDNA copy numbers in kidneys. (C‐D) Basal OCR and maximal OCR represented as the basal mitochondrial OXPHOS activity and maximal respiratory capacity respectively. (E‐F) Kidney specimens in each group were processed for immunohistochemistry staining for iNOS (scale bars, 50 μm) and quantitative analysis for positive areas. (G) Kidney tissue was processed for electron micrographs of renal mitochondria (scale bars, 1 μm). Each result was replicated in three independent experiments and all values are the mean ±SD (n = 3). *Significance compared with CON (WT) group (*p<0.05, **p < 0.01). #Significance compared with LPS (WT) group (# p < 0.05, ## p < 0.01). $Significance compared with CON (KO) group ($ p < 0.05, $$ p < 0.01). ^Significance compared with LPS (KO) group (^ p < 0.05, ^^ p < 0.01)
