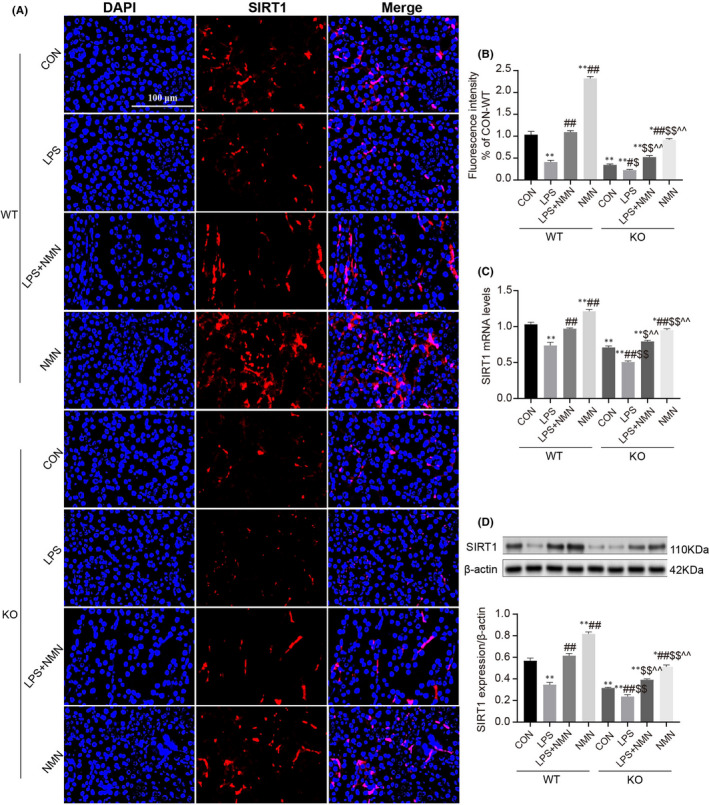
FIGURE 4.

Effect of NAD+on LPS‐induced AKI is associated with SIRT1. (A‐B) Immunofluorescence intensity of renal SIRT1 (red) in different groups (scale bars, 100 μm). (C) The relative mRNA expression of SIRT1 in kidney cortexes. (D) Representative Western blots analysis and quantitation of band density of SIRT1 expression in different groups. Each result was replicated in three independent experiments and all values are the mean ±SD (n = 3). *Significance compared with CON (WT) group (*p < 0.05, **p < 0.01). #Significance compared with LPS (WT) group (# p < 0.05, ## p < 0.01). $Significance compared with CON (KO) group ($ p < 0.05, $$ p < 0.01). ^Significance compared with LPS (KO) group (^ p < 0.05, ^^ p < 0.01)
