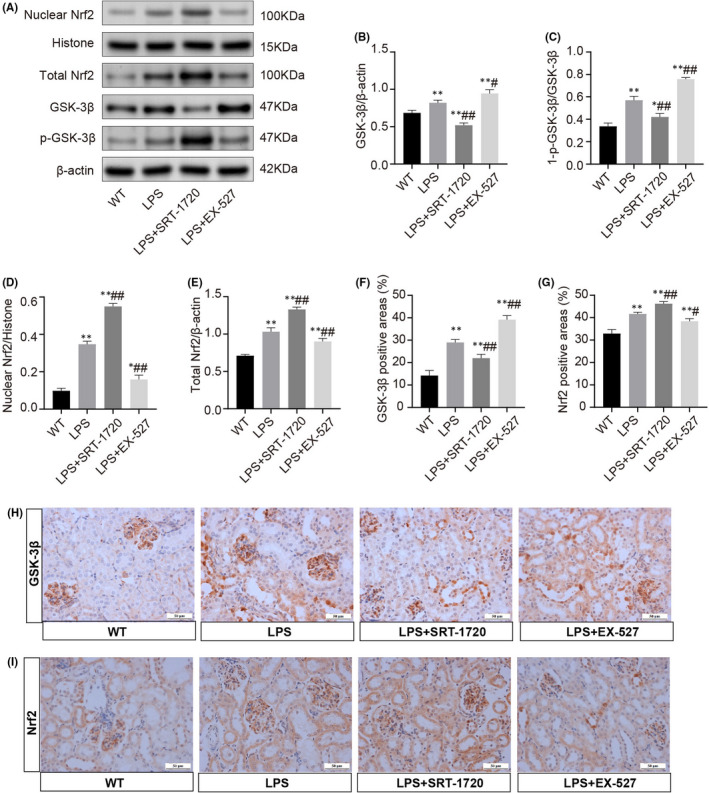
FIGURE 7.

Activation of GSK‐3β/Nrf2 signalling pathway in LPS‐induced AKI. (A) Representative Western blots show the expression of nuclear and total Nrf2, GSK‐3β and p‐ GSK‐3β in the kidney homogenates or nuclear fractions. (B) Relative expression levels of GSK‐3β in the kidney. (C) Values of 1‐ (p‐GSK‐3β/GSK‐3β) in the kidney for each subgroup. (D‐E) Nuclear and total protein expression of Nrf2 in renal tissues. (F‐I) Representative microscopic images of immunohistochemistry staining for GSK‐3β and Nrf2 (scale bars, 50 μm) and followed by quantitative analysis of positive areas. Each result was replicated in three independent experiments, and the data are presented as mean ±SD (n = 3). *Significance compared with CON group (*p < 0.05, **p < 0.01). #Significance compared with LPS group (# p < 0.05, ## p < 0.01)
