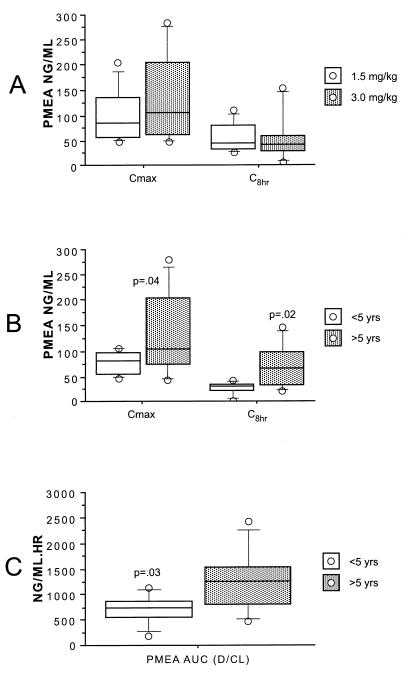
FIG. 3.
Comparison of Cmax and C8 with dose (A) and age (B) and comparison of AUC with age (C). (A) Box plots showing the influence of adefovir dipivoxil dose on the Cmax and C8 of PMEA in serum. (B) Box plots showing the influence of patient age on the Cmax and C8 of PMEA in serum. (C) Box plots showing the influence of patient age on the AUC for PMEA in serum. D, range of AUC.

