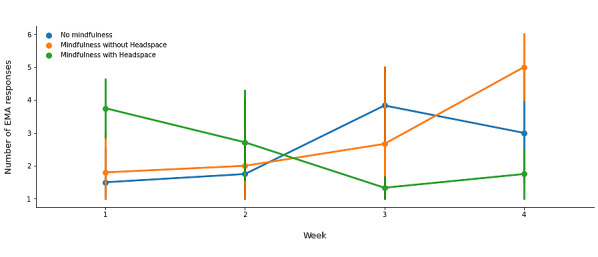
Figure 7.

Self-reported engagement with a mindfulness activity by week in study (n=8). Points represent the average number of ecological momentary assessment (EMA) responses within a week across participants, and error bars represent a 95% CI around the mean value. Each trajectory represents a specific type of EMA response (eg, “Mindfulness without Headspace”) as indicated in the legend.
