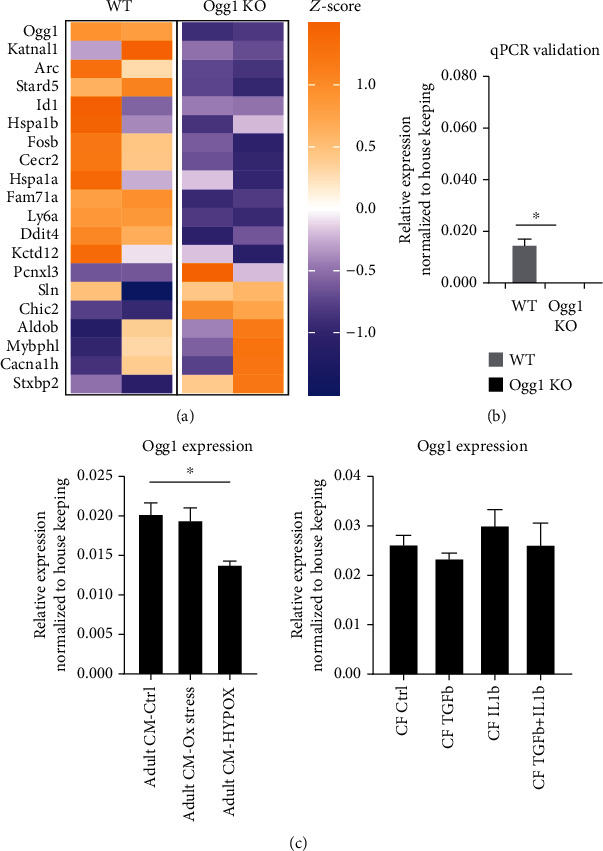
Figure 1.

Expression of Ogg1 in cardiomyocytes and cardiac fibroblasts at baseline. (a) Heat map showing the transcriptomic differences in the cardiomyocytes (CM) of wild-type (WT) mice compared to Ogg1-KO mice at baseline identified through RNA-sequencing analysis with a few genes highlighted. Z-scores are computed on a gene-by-gene basis and obtained by subtracting the mean and dividing by standard deviation. (b) qPCR validation of Ogg1 mRNA expression in wild-type (WT) and Ogg1-KO CMs. All values are mean ± SE. n = 3∗P < 0.05. (c) Expression of Ogg1 mRNA evaluated by qPCR in cardiomyocytes (CM) subjected to oxidative stress (Ox stress) and hypoxia (HYPOX), as well as cardiac fibroblasts (CF) in the heart treated with different stimuli. All values are mean ± SE. n = 3∗P < 0.05.
