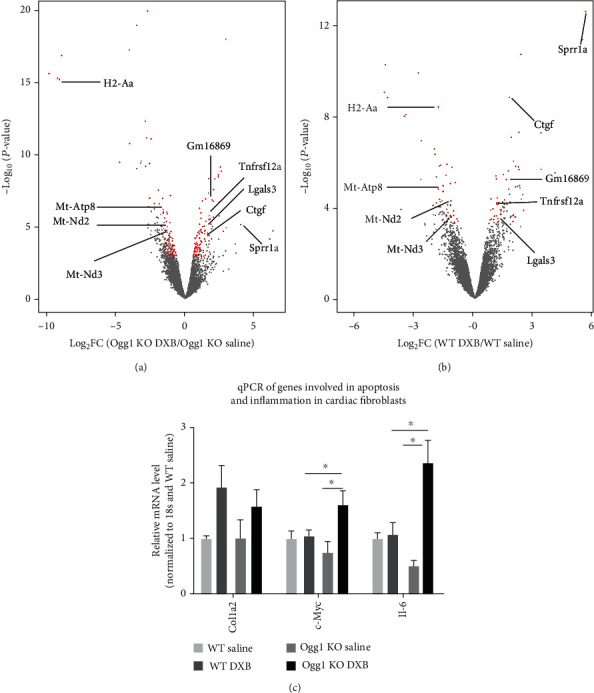
Figure 6.

Transcriptomic profile after doxorubicin treatment in WT and Ogg1-KO mice. (a and b) Volcano plot showing genes that are changing after treatment with doxorubicin. The red dots are genes with fold change of log2 ≥ 0.5 and FDRvalue < 0.1. Some genes are highlighted. (c) qPCR of Col1a2, c-Myc, and Il-6 in cardiac fibroblasts in the heart after treatment with doxorubicin.
