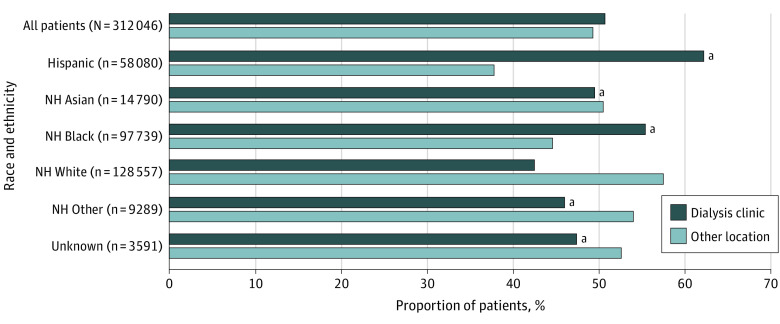
Figure. Proportion of Vaccinated Patients Who Received a COVID-19 Vaccination in a Dialysis Clinic vs Other Location by Race and Ethnicity.
Race and ethnicity were from patient self-report via data submitted from DaVita Inc and Fresenius Medical Care to the Centers for Disease Control and Prevention. Non-Hispanic White is the reference group for all other patient race and ethnicity categories. Other includes American Indian/Alaska Native, Native Hawaiian, Pacific Islander, and multirace. NH indicates non-Hispanic.
aP < .001.

