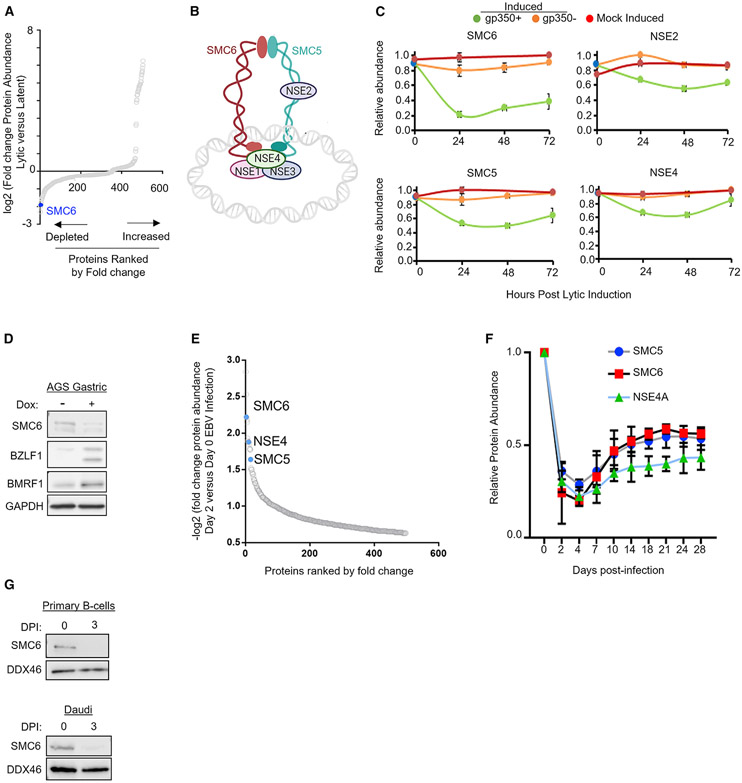
Figure 1. The SMC5/6 cohesin complex is depleted by incoming EBV and lytic replication.
(A) Waterfall plot illustrating the log2 fold change in protein abundance of host proteins that significantly change (p < 0.05) 24 h after lytic reactivation of P3HR-1 ZHT/RHT cells mock-induced or induced for lytic reactivation by 4-HT (Ersing et al., 2017).
(B) Schematic of the SMC5/6 complex.
(C) Temporal proteomic plots of SMC5/6 complex subunit relative protein abundances in mock-induced (red) or 4-HT induced ZHT/RHT P3HR-1 cells that entered productive lytic cycles and expressed the late gene gp350 (green), or that did not become gp350+ (orange), are indicated. Error bars indicate mean ± SE (n = 3 replicates).
(D)Immunoblot analysis of whole-cell lysates (WCLs) from EBV+ AGS gastric carcinoma cells with a conditional BZLF1 allele induced for lytic replication by doxycycline (2 μg/mL) for 48 h.
(E) Plot of −log2 fold change in protein abundance of host proteins that were significantly different in proteomics analysis of primary human B cells infected with B95.8 EBV at 48 h of infection versus in resting B cells.
(F) Temporal proteomics plots of SMC5/6 complex abundance on the indicated days after primary human B-cell EBV infection. Data show the mean ± SE (n = 4).
(G) Immunoblot of SMC6 versus the DDX46 load control values in primary (top) or Daudi B cells at 0 versus 3 days post infection (DPI).
Blots in (D) and (G) are representative of 2 replicates. See also Figure S1.

