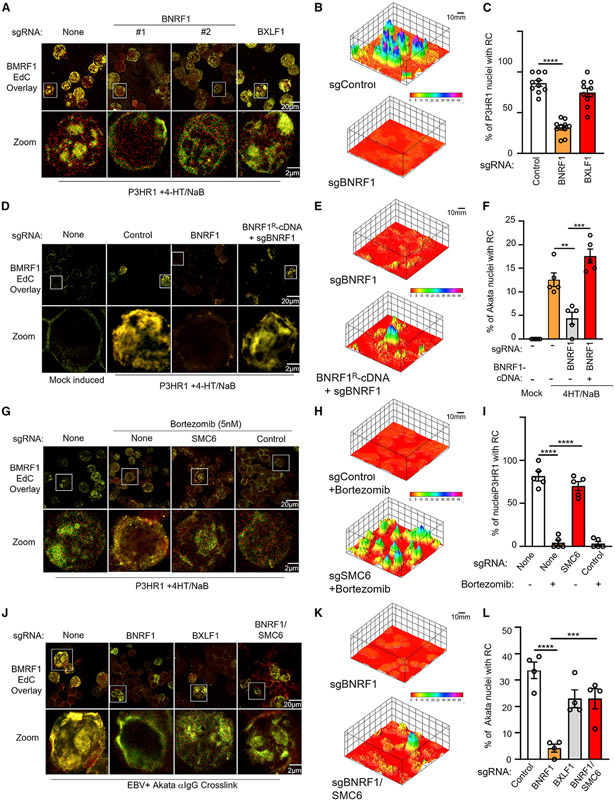
Figure 5. BNRF1 is critical for viral RC formation.
(A) Immunofluorescence analysis of replication compartments (RCs), as judged by EdC-labeled DNA and staining for BMRF1 in P3HR-1 ZHT/RHT cells that expressed the indicated sgRNAs and that were induced by 4-HT/NaB for 24 h. Magnified images of cells in white boxes are shown at the bottom.
(B) 3D reconstruction of EdC and BMRF1 signals as in (A), using the ImageJ Interactive 3D Surface Plot package. The scale bar indicates fluorescence intensity.
(C) Mean ± SEM percentages of nuclei with RCs from 3 replicates as in (A), using data from 10 randomly selected panels of 150 nuclei and ImageJ.
(D) RC immunofluorescence analysis as in (A), using P3HR-1 ZHT/RHT cells that expressed the indicated sgRNAs and rescue BNRF1 cDNA.
(E) 3D reconstruction of EdC and BMRF1 signals as in (D), using the ImageJ Interactive 3D Surface Plot package.
(F) Mean ± SEM percentages of nuclei with RCs from 3 replicates as in (D), using data from 5 randomly selected panels of 75 nuclei and ImageJ.
(G) RC immunofluorescence analysis as in (A), using P3HR-1 ZHT/RHT cells that expressed no sgRNA, control or SMC6 sgRNA, and were treated with bortezomib, as indicated.
(H) 3D reconstruction of EdC and BMRF1 signals as in (G), using the ImageJ Interactive 3D Surface Plot package.
(I) Mean ± SEM percentages of nuclei with RCs from 3 replicates as in (G), using data from 5 randomly selected panels of 75 nuclei and ImageJ.
(J) RC immunofluorescence analysis as in (A), using P3HR-1 ZHT/RHT cells that expressed the indicated sgRNAs.
(K) 3D reconstruction of EdC and BMRF1 signals as in (J), using the ImageJ Interactive 3D Surface Plot package.
(L) Mean ± SEM percentages of nuclei with RCs from 3 replicates as in (D), using data from 4 randomly selected panels of 60 nuclei and ImageJ.
See also Figures S5-S7.

