. 2022 Jan 30;12(7):3809–3827. doi: 10.1039/d1ra06149f

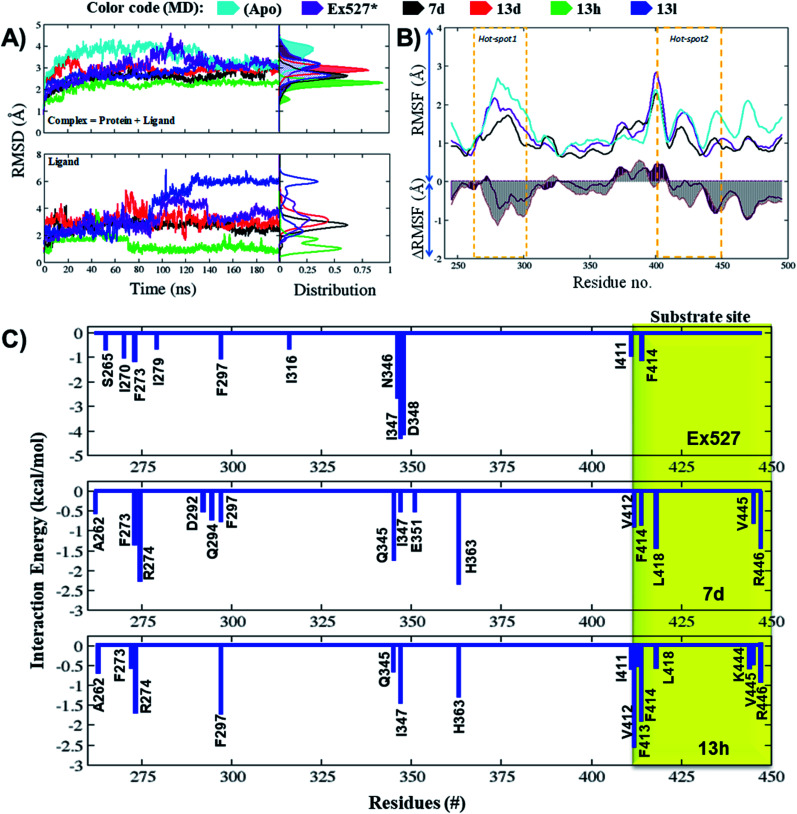
Fig. 5. Molecular dynamics simulations reflect the significant changes in ligand behavioral patterns. (A and B) MD trajectory analysis of apo Sirt1 and protein–ligand complexes of 7d, 13d, 13h and 13l. (A) The root mean square deviation (RMSD) of protein (all backbone atoms) and ligand in coordinates as a function of the simulation time. (B) The root mean square fluctuation (RMSF) and ΔRMSF of C-alpha atoms of MD systems, Sirt1-apo, Sirt1-Ex527* and Sirt1-7d. (C) Per-residue energy decomposition of Ex527*, 7d and 13d. The residue which reflected the major contribution in binding free energies (ΔGpbsa ≤ −0.5 kcal mol−1) is shown in the graphs. The region highlighted with yellow color background belongs to the substrate-binding site.

Fig. 5