. 2022 Jan 30;12(7):3809–3827. doi: 10.1039/d1ra06149f

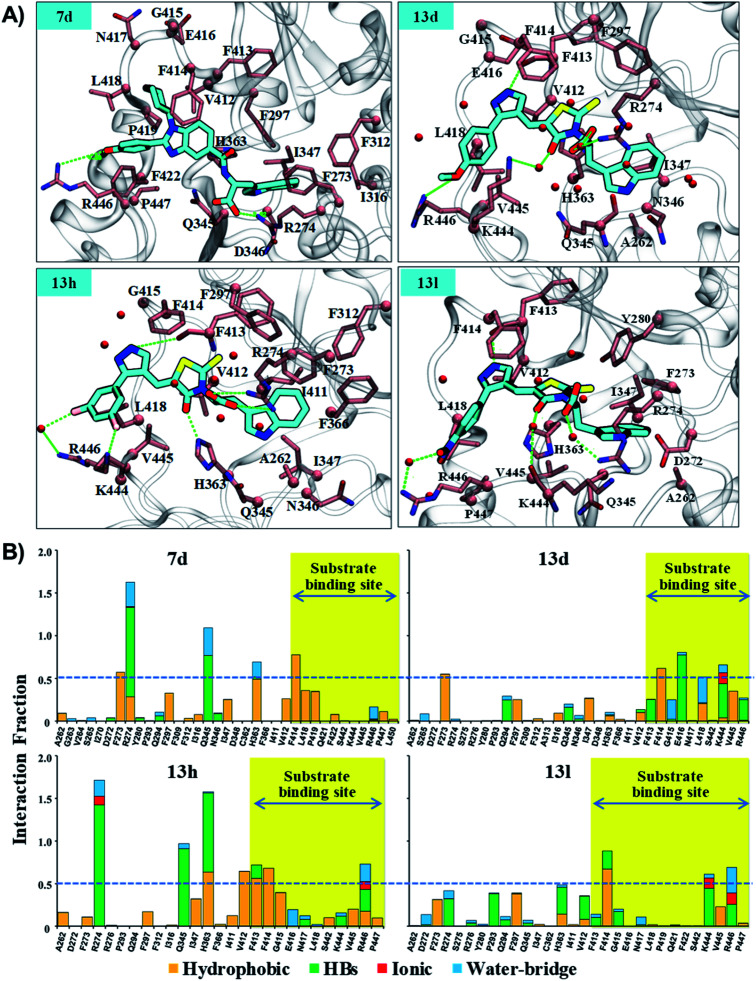
Fig. 6. The residue interaction analysis of ligands 7d, 13d, 13h and 13l. (A) The interaction map of 7d, 13d, 13h, and 13l. The ligands 7d, 13d, 13h and 13l are shown in “stick” representation in color-type “element” with “C” in fluorescent cyan. The key residue within 3.5 Å cutoff from ligands are highlighted in color-type “element” with “C” in pink color. The C-alpha atom and side chain are shown in “sphere” and “stick” representation, respectively. Backbone atoms are shown for only those residues which are involved in HB interaction. Backbone atoms are shown in stick representation. Water (oxygen atom) within 2.5 Å from the ligand is shown in sphere representation in red color. HBs are shown with a dotted line and green color. (B) The residue interaction fraction analysis of complex systems, control (Sirt1-Ex527*), 7d (Sirt1-7d), 13d (Sirt1-13d), 13h (Sirt1-13h) and 13l (Sirt1-13l) throughout 200 ns MD simulation. The dotted line represents a cut-off value of 0.5, which indicated that the specific interaction is maintained ≥50% of the total simulation time.

Fig. 6